
CSAS Data: Graphs & Plots
Wind | Air Temps | Precip | Snowpack | Soil | Stream flow | Radiation
For the wind rose graphs, you may want to see our wind rose metadata as well as our wind rose generator.
Below are 3 windroses depicting the same storm event and typical differences between our 3 Study Plots.
|
SASP is wind protected
|
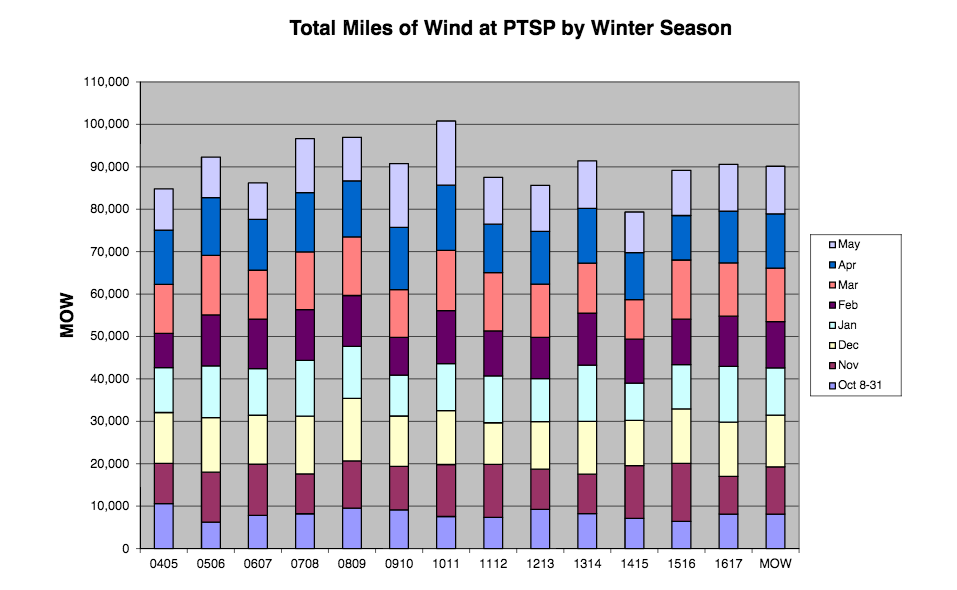
PTSP is our best site for measuring wind
|
SBSP, our alpine site, shows terrain steering
|
 |
 |
 |
Click image below for a series of slides comparing Wind Roses from 5 winters, 5 summers, and 2 study plots (PTSP, SBSP).
We recommend viewing in PowerPoint, though a PDF version is also available.


