Home
Data
News & Pubs
Programs
Facilities
Friends, Funders & Partners
About Us
Current Conditions
Winter Storm Data
Wind Rose Tool
Graphed Data
Archived Data
Researcher Datasets
Data Use Policy
CSAS News
Publications & Presentations
Popular Press
Mountain System Monitoring
Colorado Dust-on-Snow (CODOS)
Interdisciplinary Research
Field Education & Workshops
Client Services
Overview
Senator Beck Basin Study Area
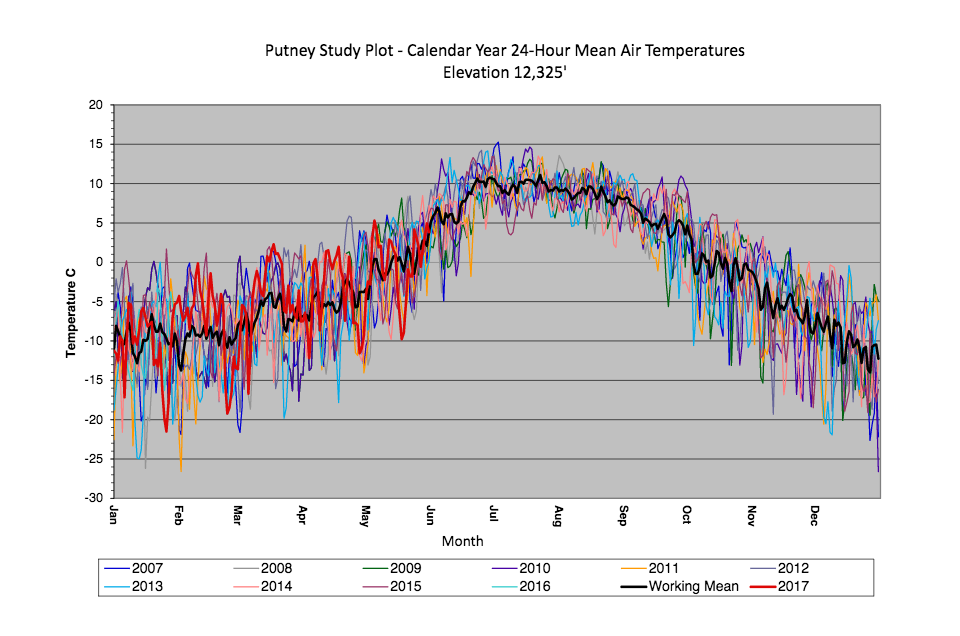
Putney Study Plot
Swamp Angel Study Plot
Senator Beck Study Plot
SB Stream Gauge
Agency Stakeholders
Friends of CSAS
Research Funding
Our Clients
Give to CSAS
CSAS Fact Sheet
History
Board & Staff
Contact Us
CSAS Data: Graphs & Plots
Wind
| Air Temps |
Precip
|
Snowpack
|
Soil
|
Stream flow
|
Radiation