 Colorado Dust-on-Snow Program
WY 2013 Summary
Summary | Dust Log | Winter Storms and Wind | Snowpack | Melt Rate | Stream Flows | New and Ongoing Research | Program Funding
Summary
Water Year 2013 entered late winter with dismal snowpack development at ten of eleven CODOS dust-on-snow monitoring sites, Willow Creek Pass being the single exception. Through March 2013, snowpack SWE totals at all other sites resembled or even fell short of the very dry winter of WY 2012, raising concerns about back-to-back drought seasons. That broadly consistent spatial pattern in scant precipitation began to diverge in April, 2013. CODOS sites in the northern Front Range and Colorado River headwaters benefitted most from a series of April and May winter storms that augmented snowpacks and eventually resulted in average or even above average peak SWE levels on average or later-than-average dates. In the southwestern mountains, fewer and/or smaller April/May storms failed to offset the dry beginning to WY2013 winter. CODOS sites in the San Juan Mountains experienced, for the second year, substantially sub-par peak SWE values, on near-average dates. In between, the Central Mountains, Hoosier Pass, Park, and northern Gore ranges came closer to but still fell short of average snowpacks.
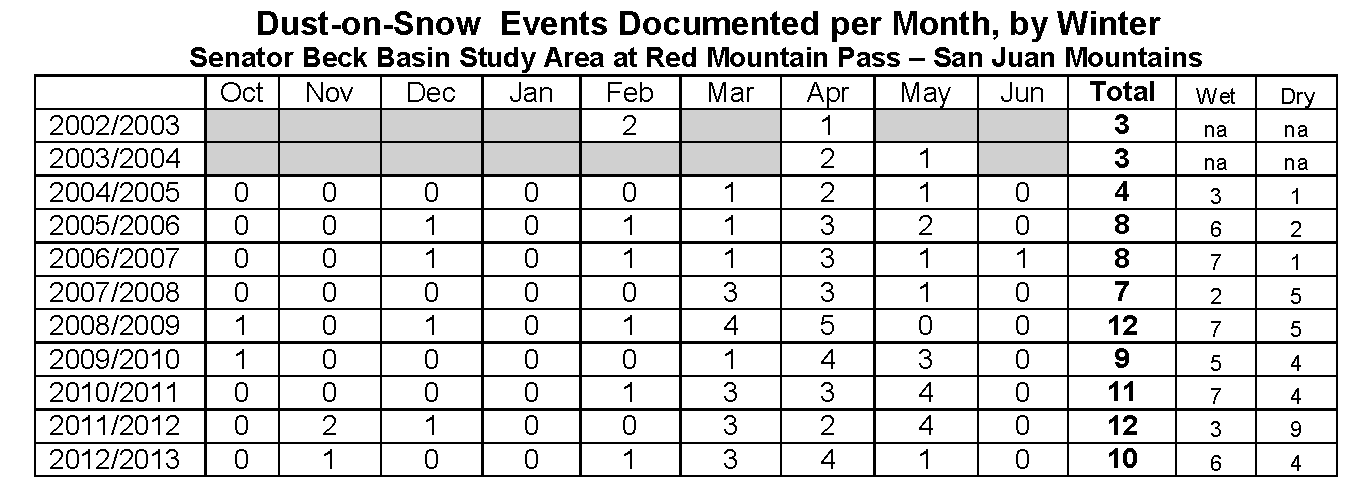
At the CSAS Senator Beck Basin Study Area at Red Mountain Pass, the primary CODOS monitoring site, WY2013 produced a total of ten separate dust-on-snow events, a lower total count than in the past three seasons. However, the actual mass of dust deposited at Senator Beck Basin in WY 2013 was greater than in any prior season, including the “Martian Winter” of WY 2009. Dust season began at Senator Beck Basin in November with a single event, February and March delivered four additional events, but the vast majority of dust deposition occurred during events D6 on April 8th and the long-duration D8 event of April 15-17. As of late March, dust layers observed at Senator Beck Basin were either weak or not present at CODOS sites farther north and east, creating some hope that WY 2013 might be dust-free in parts of the state. Then, dust events D6 and D8 spelled the end to that possibility with significant depositions statewide near the top of the snowpack.
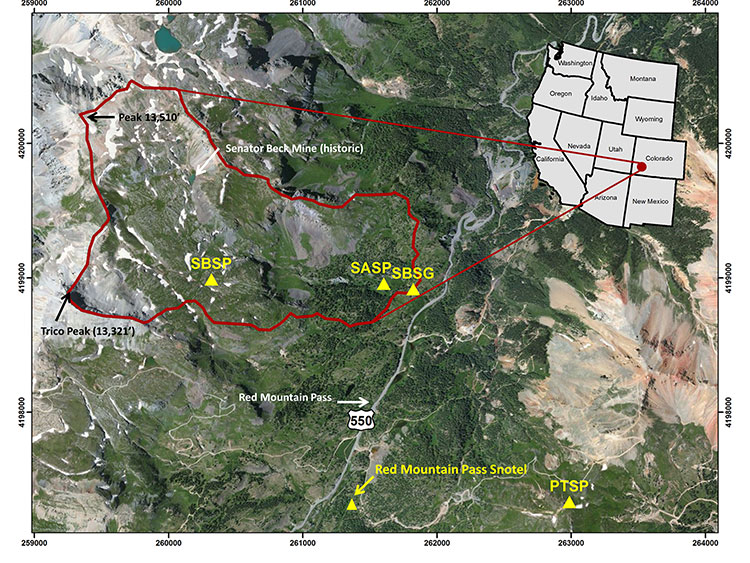
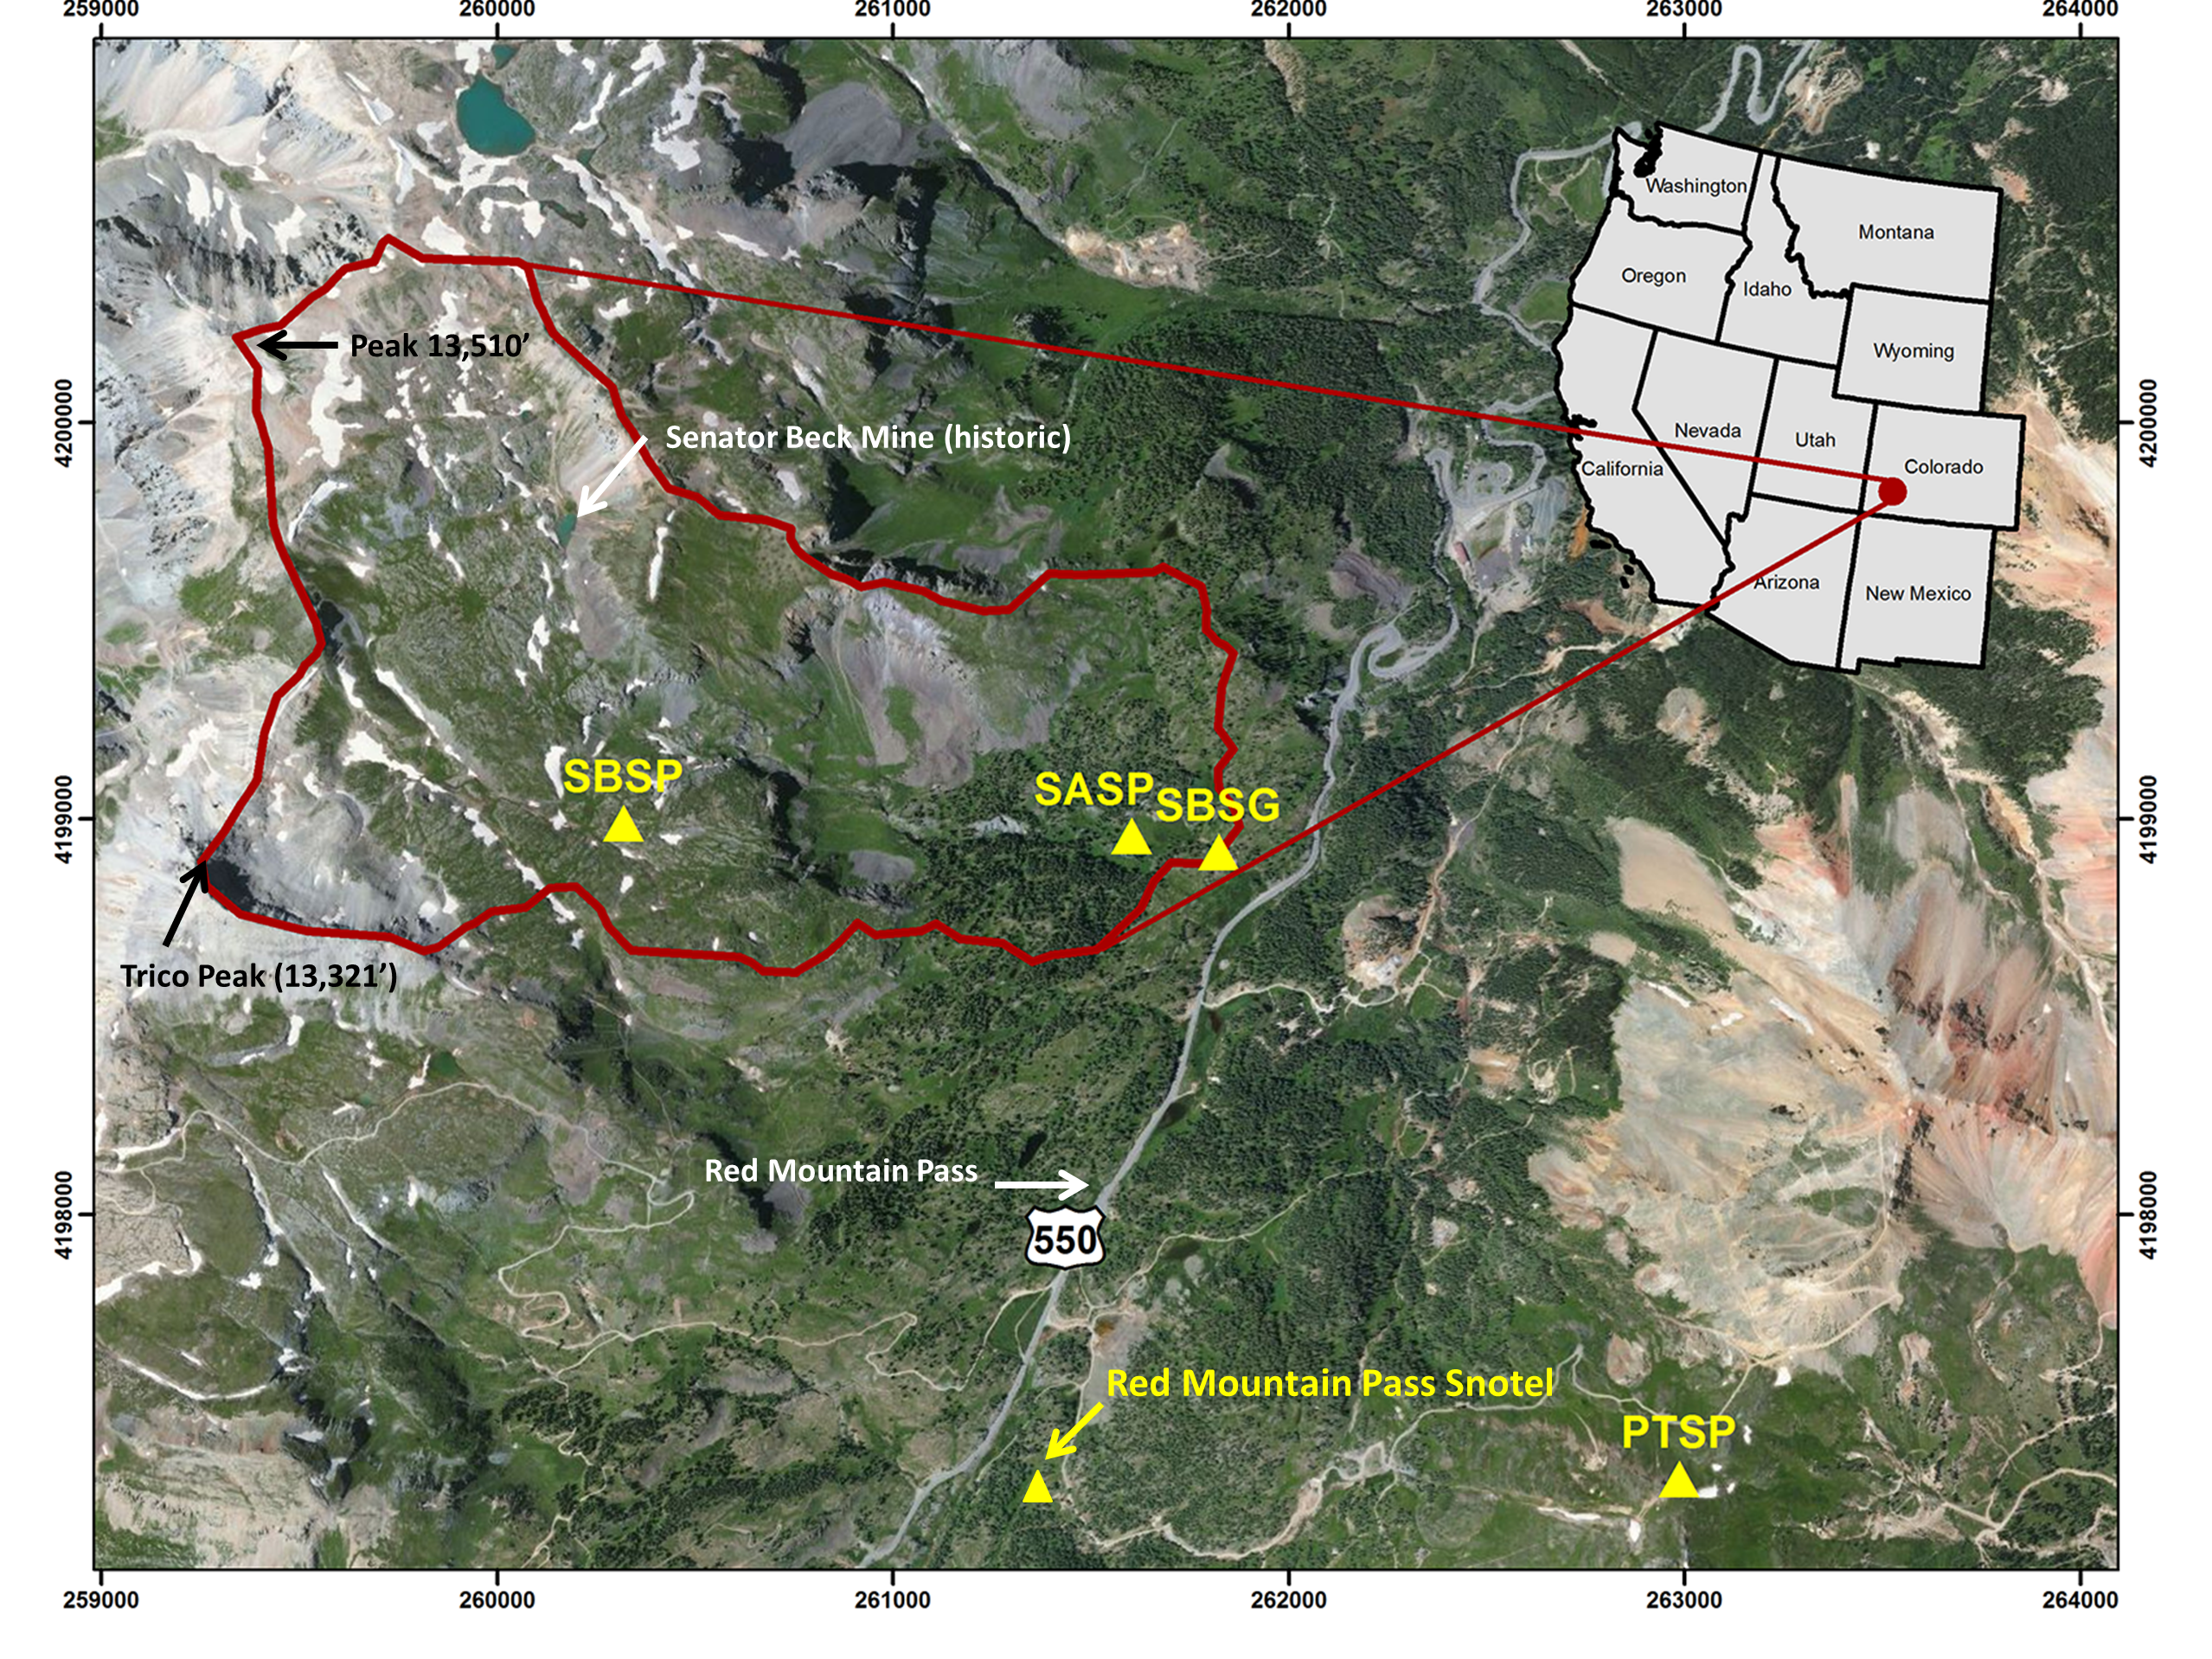
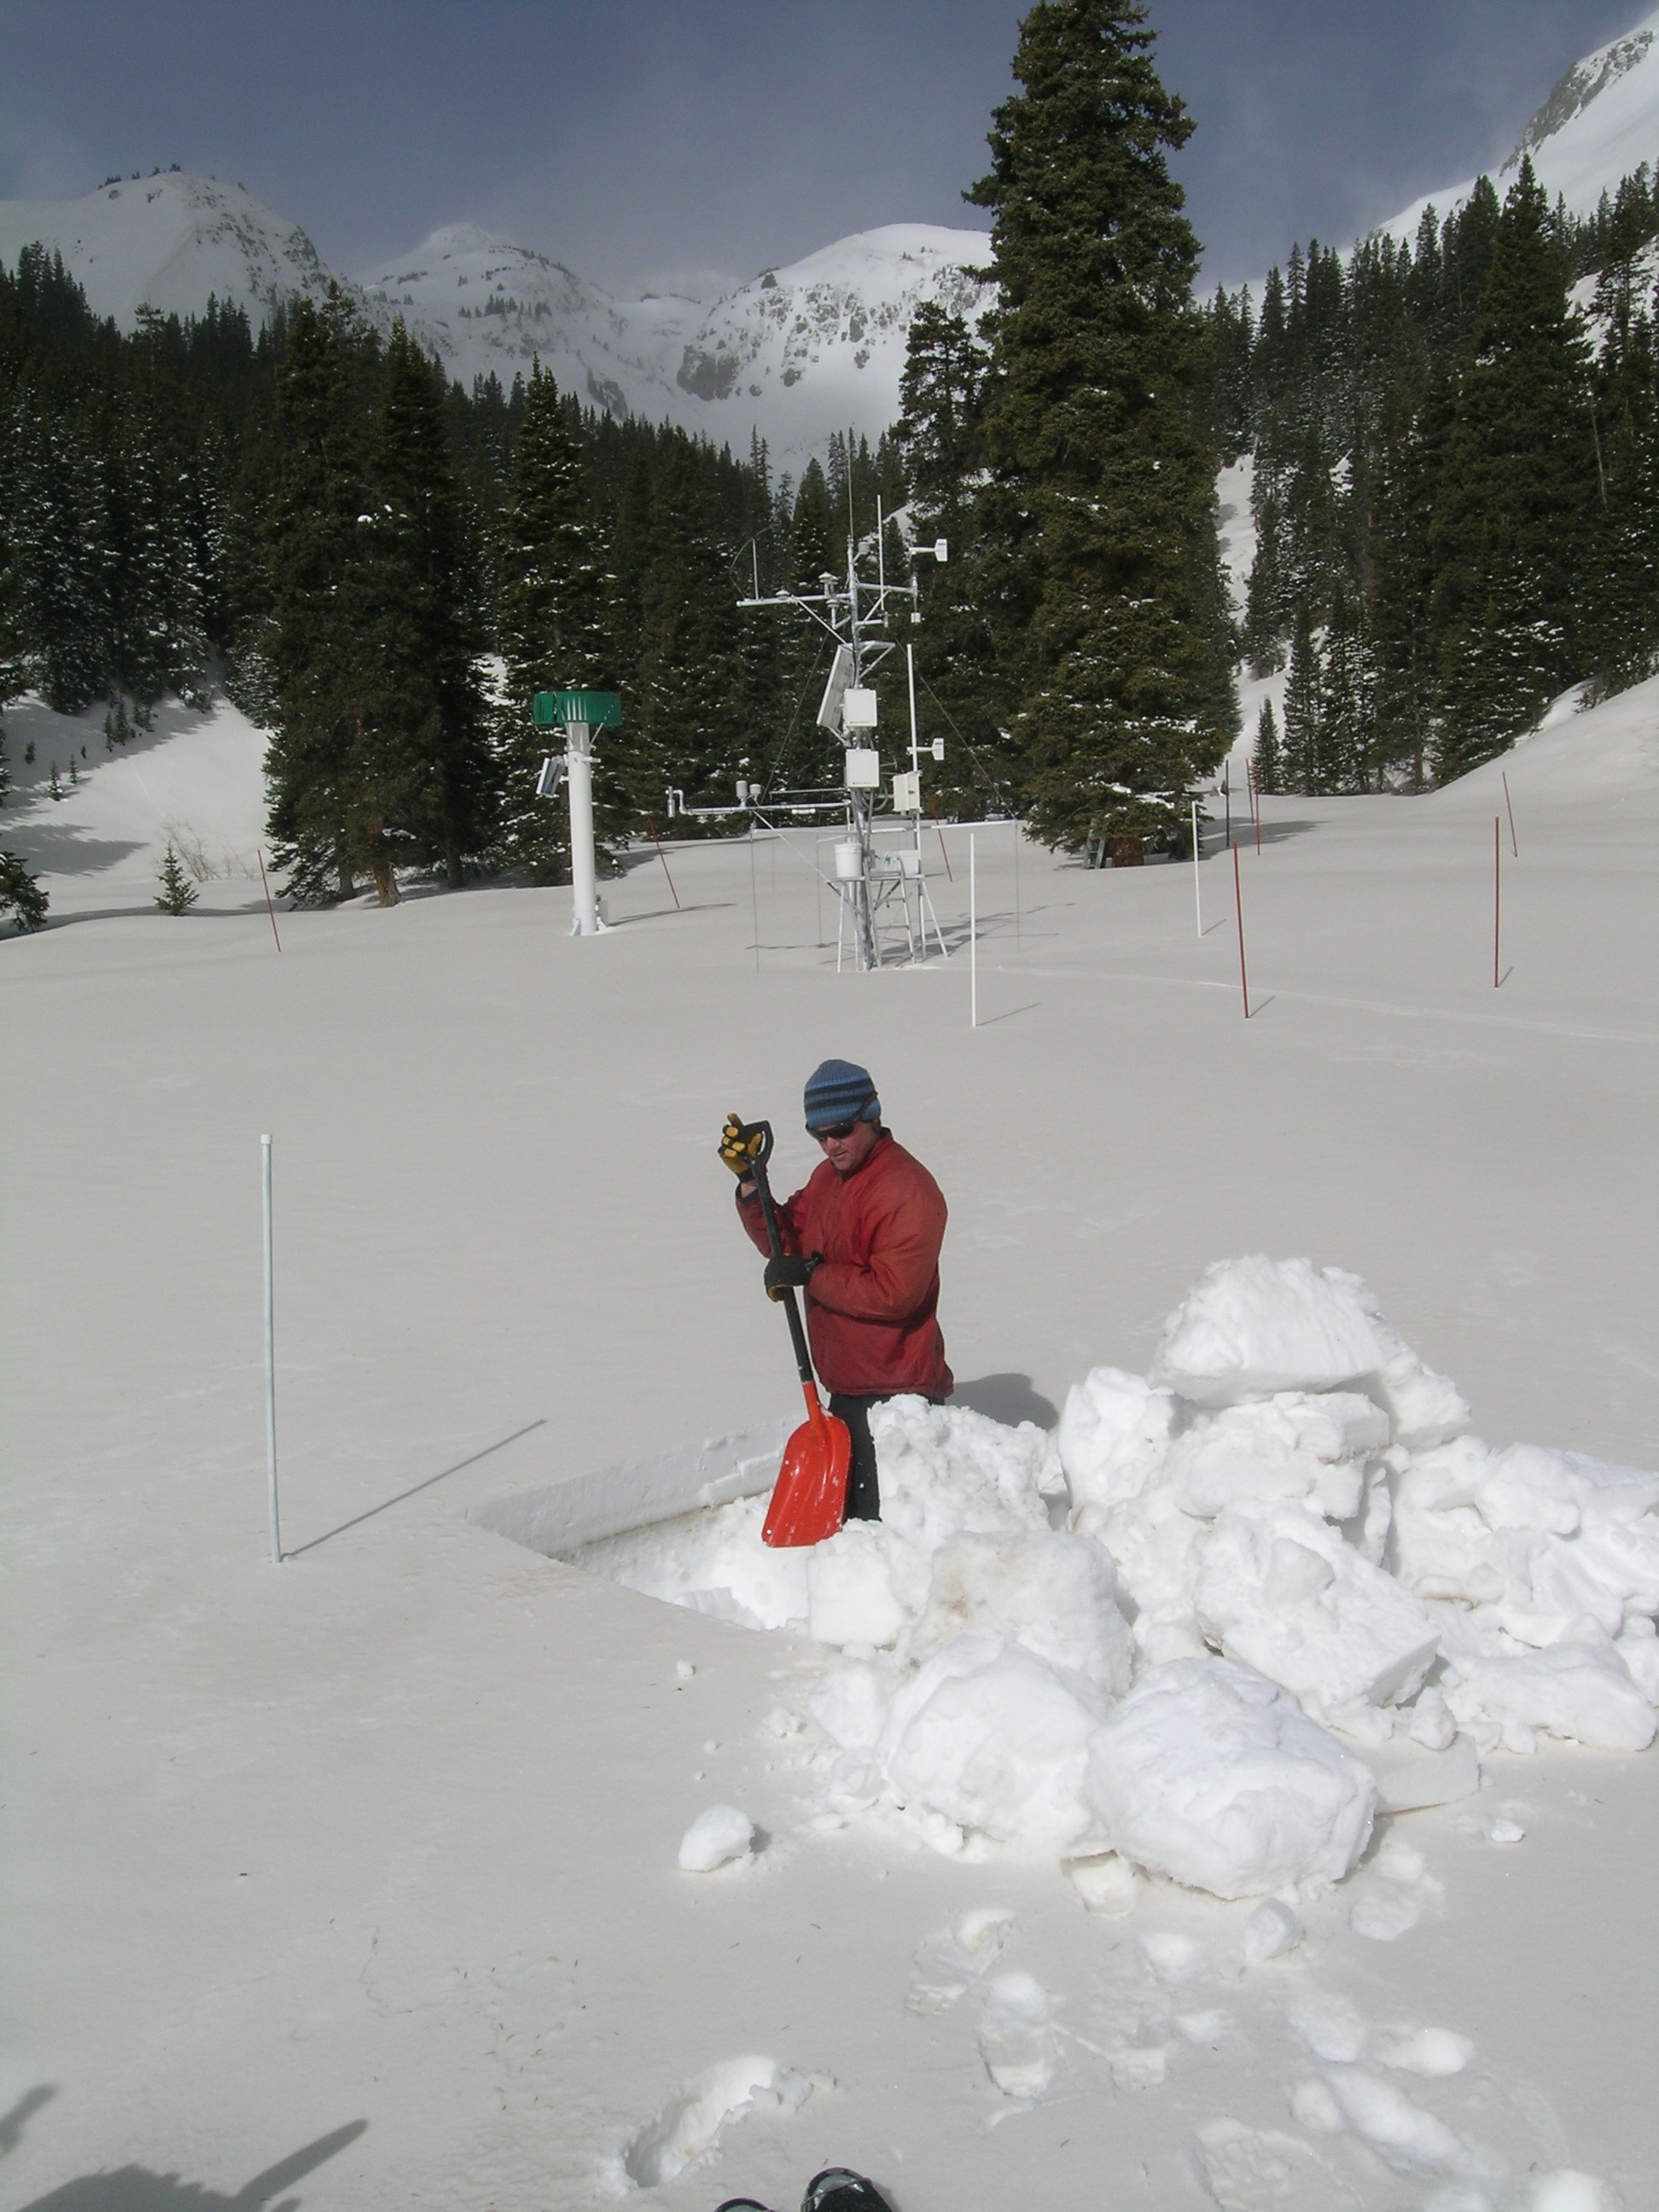
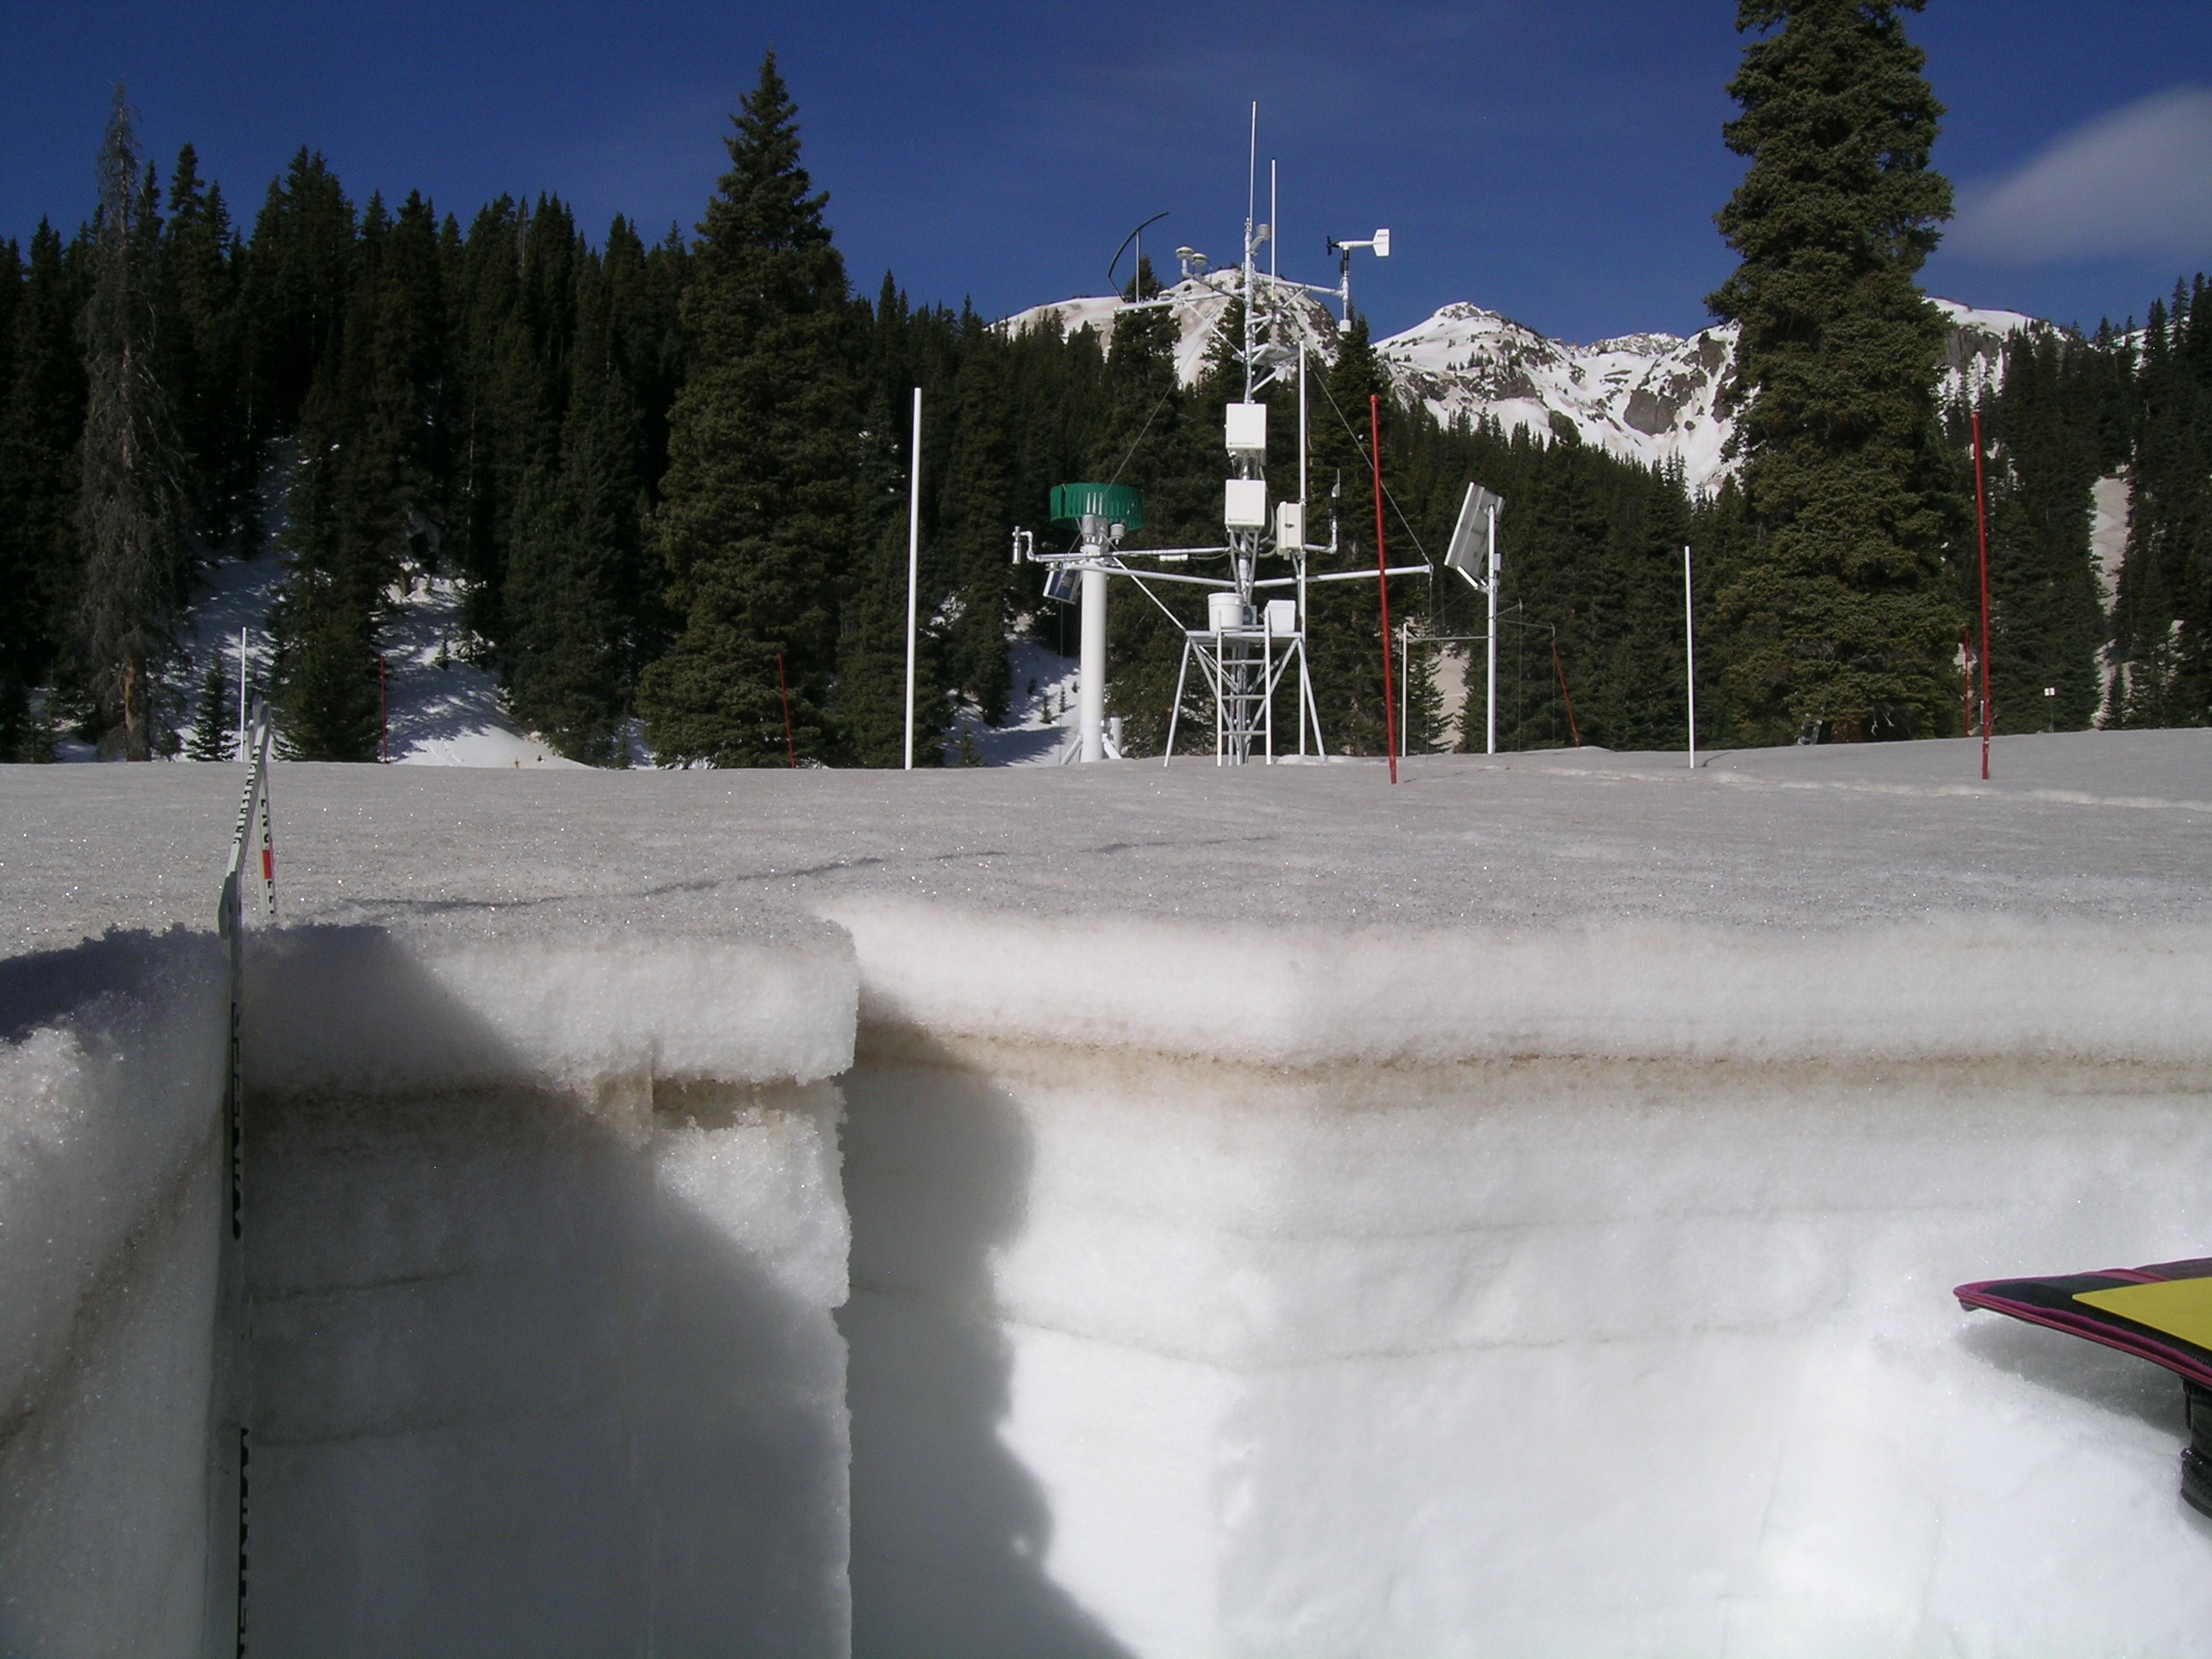
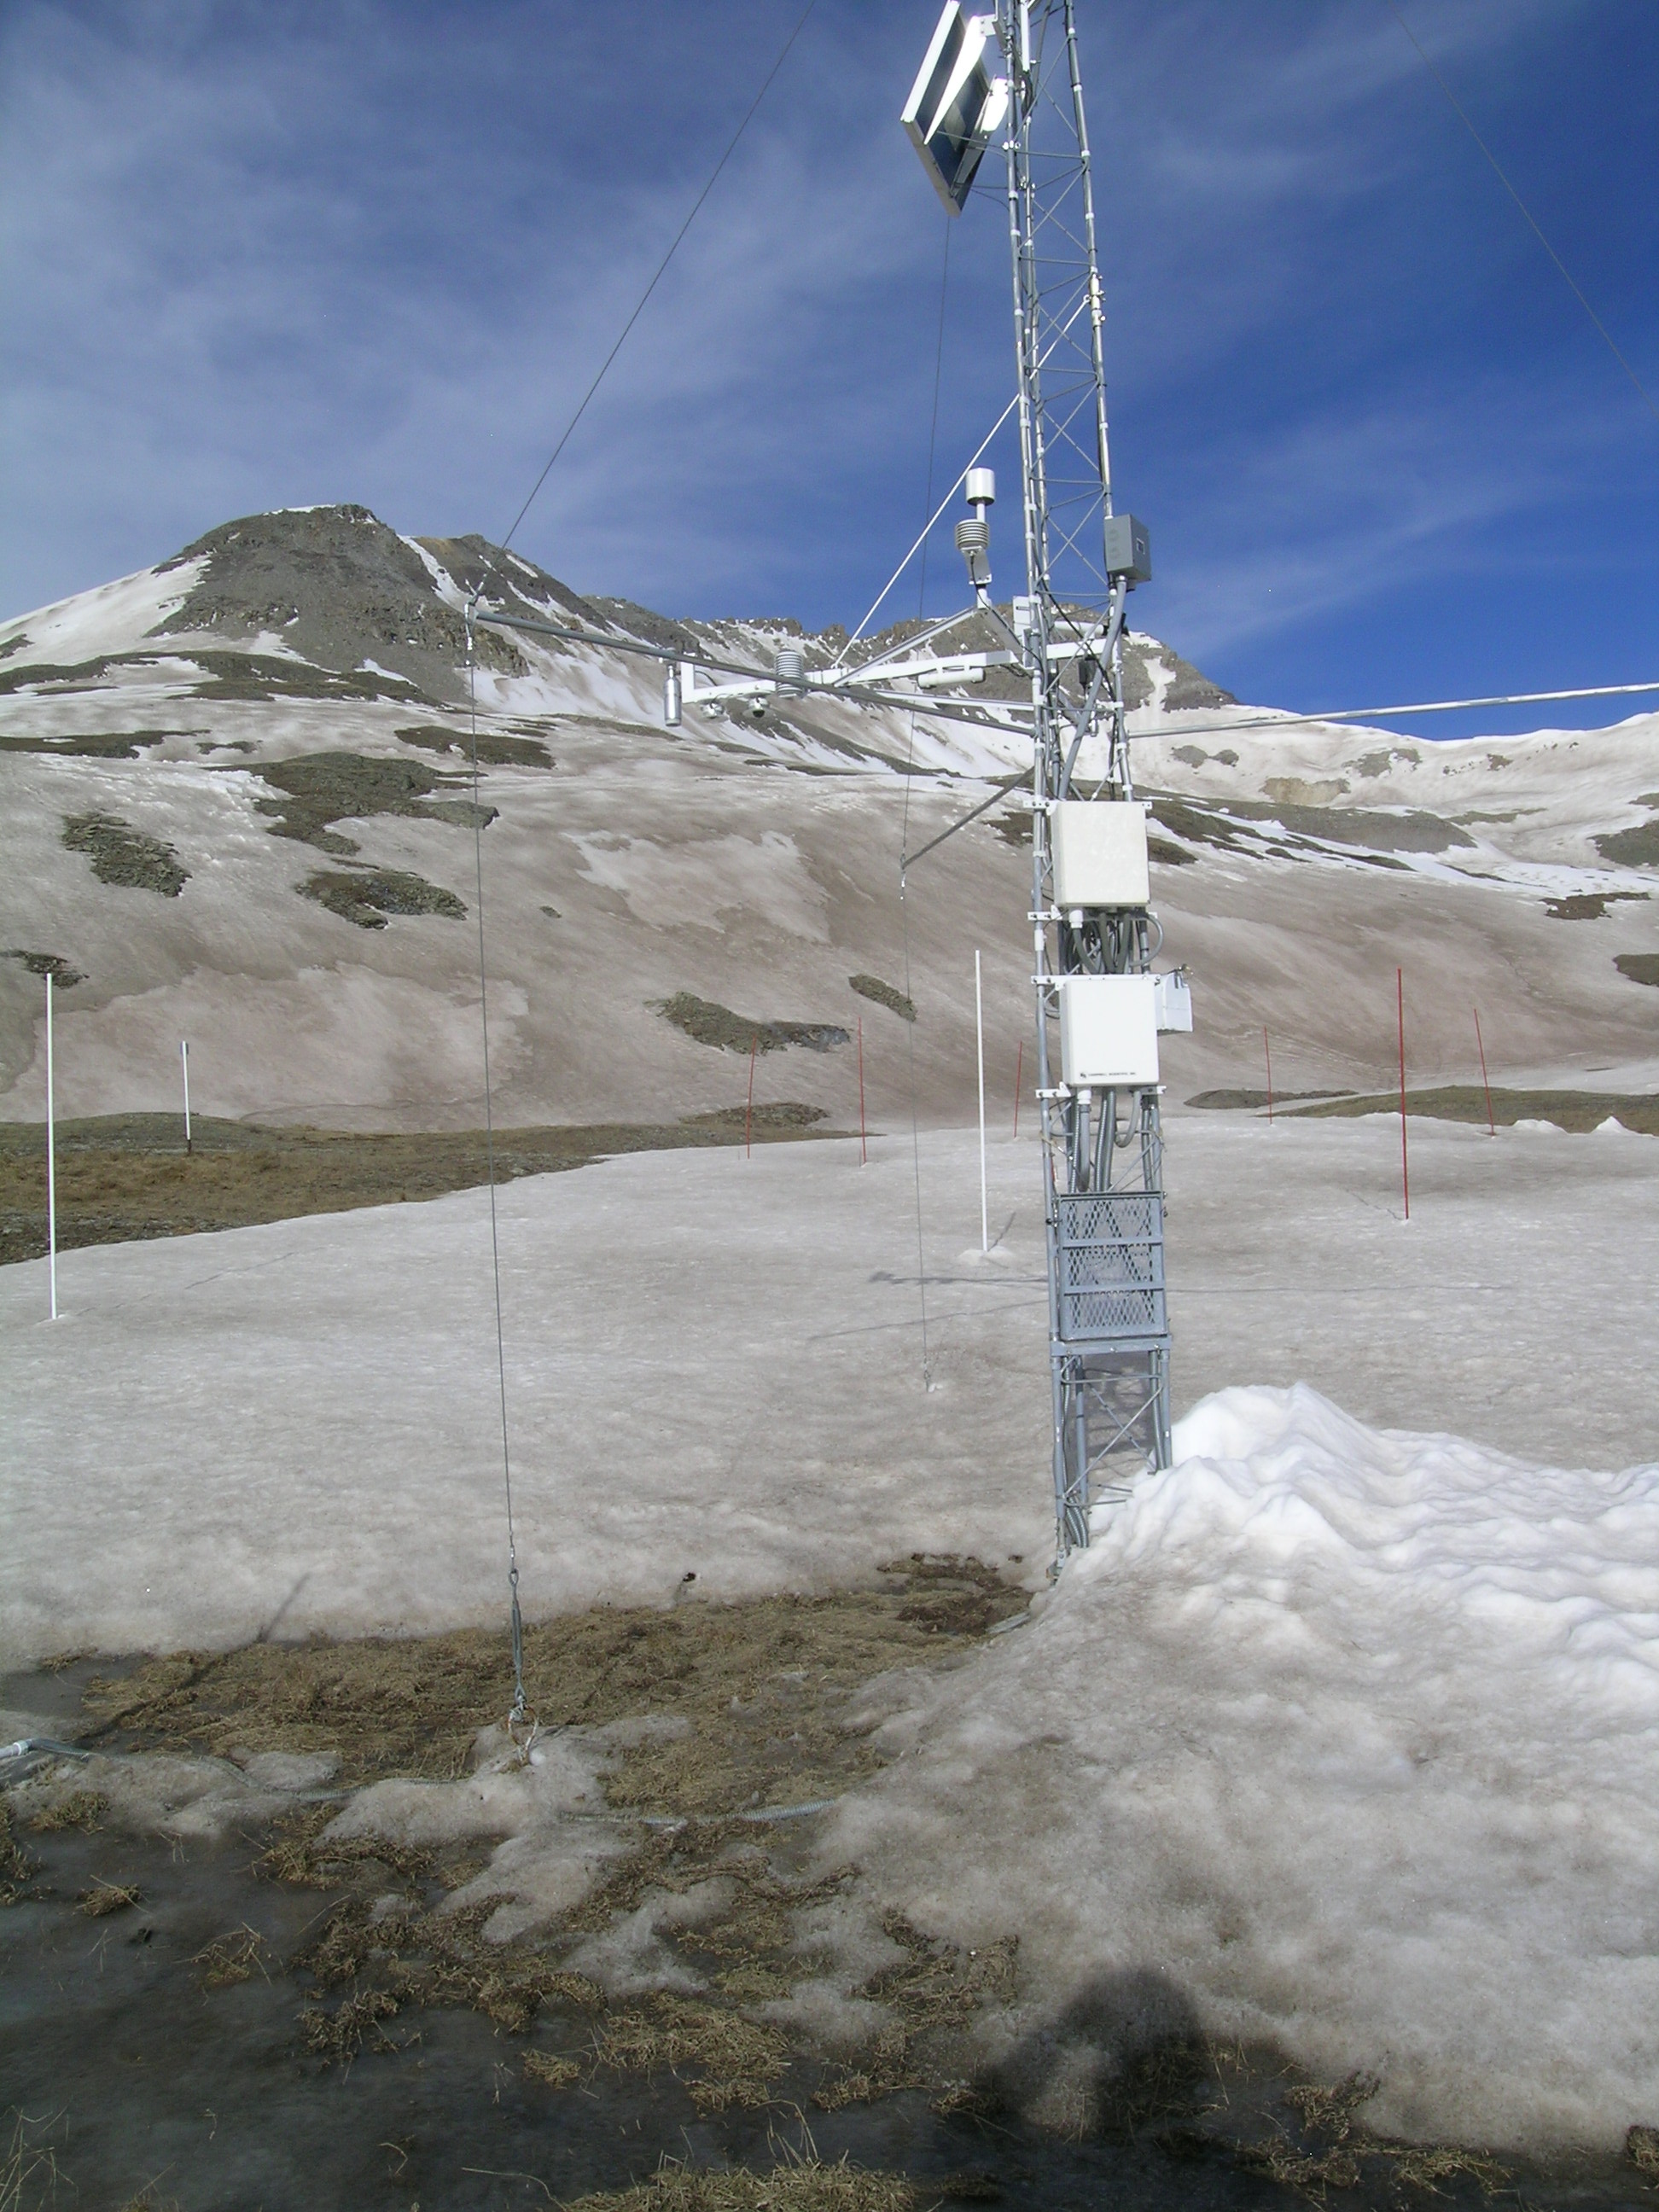
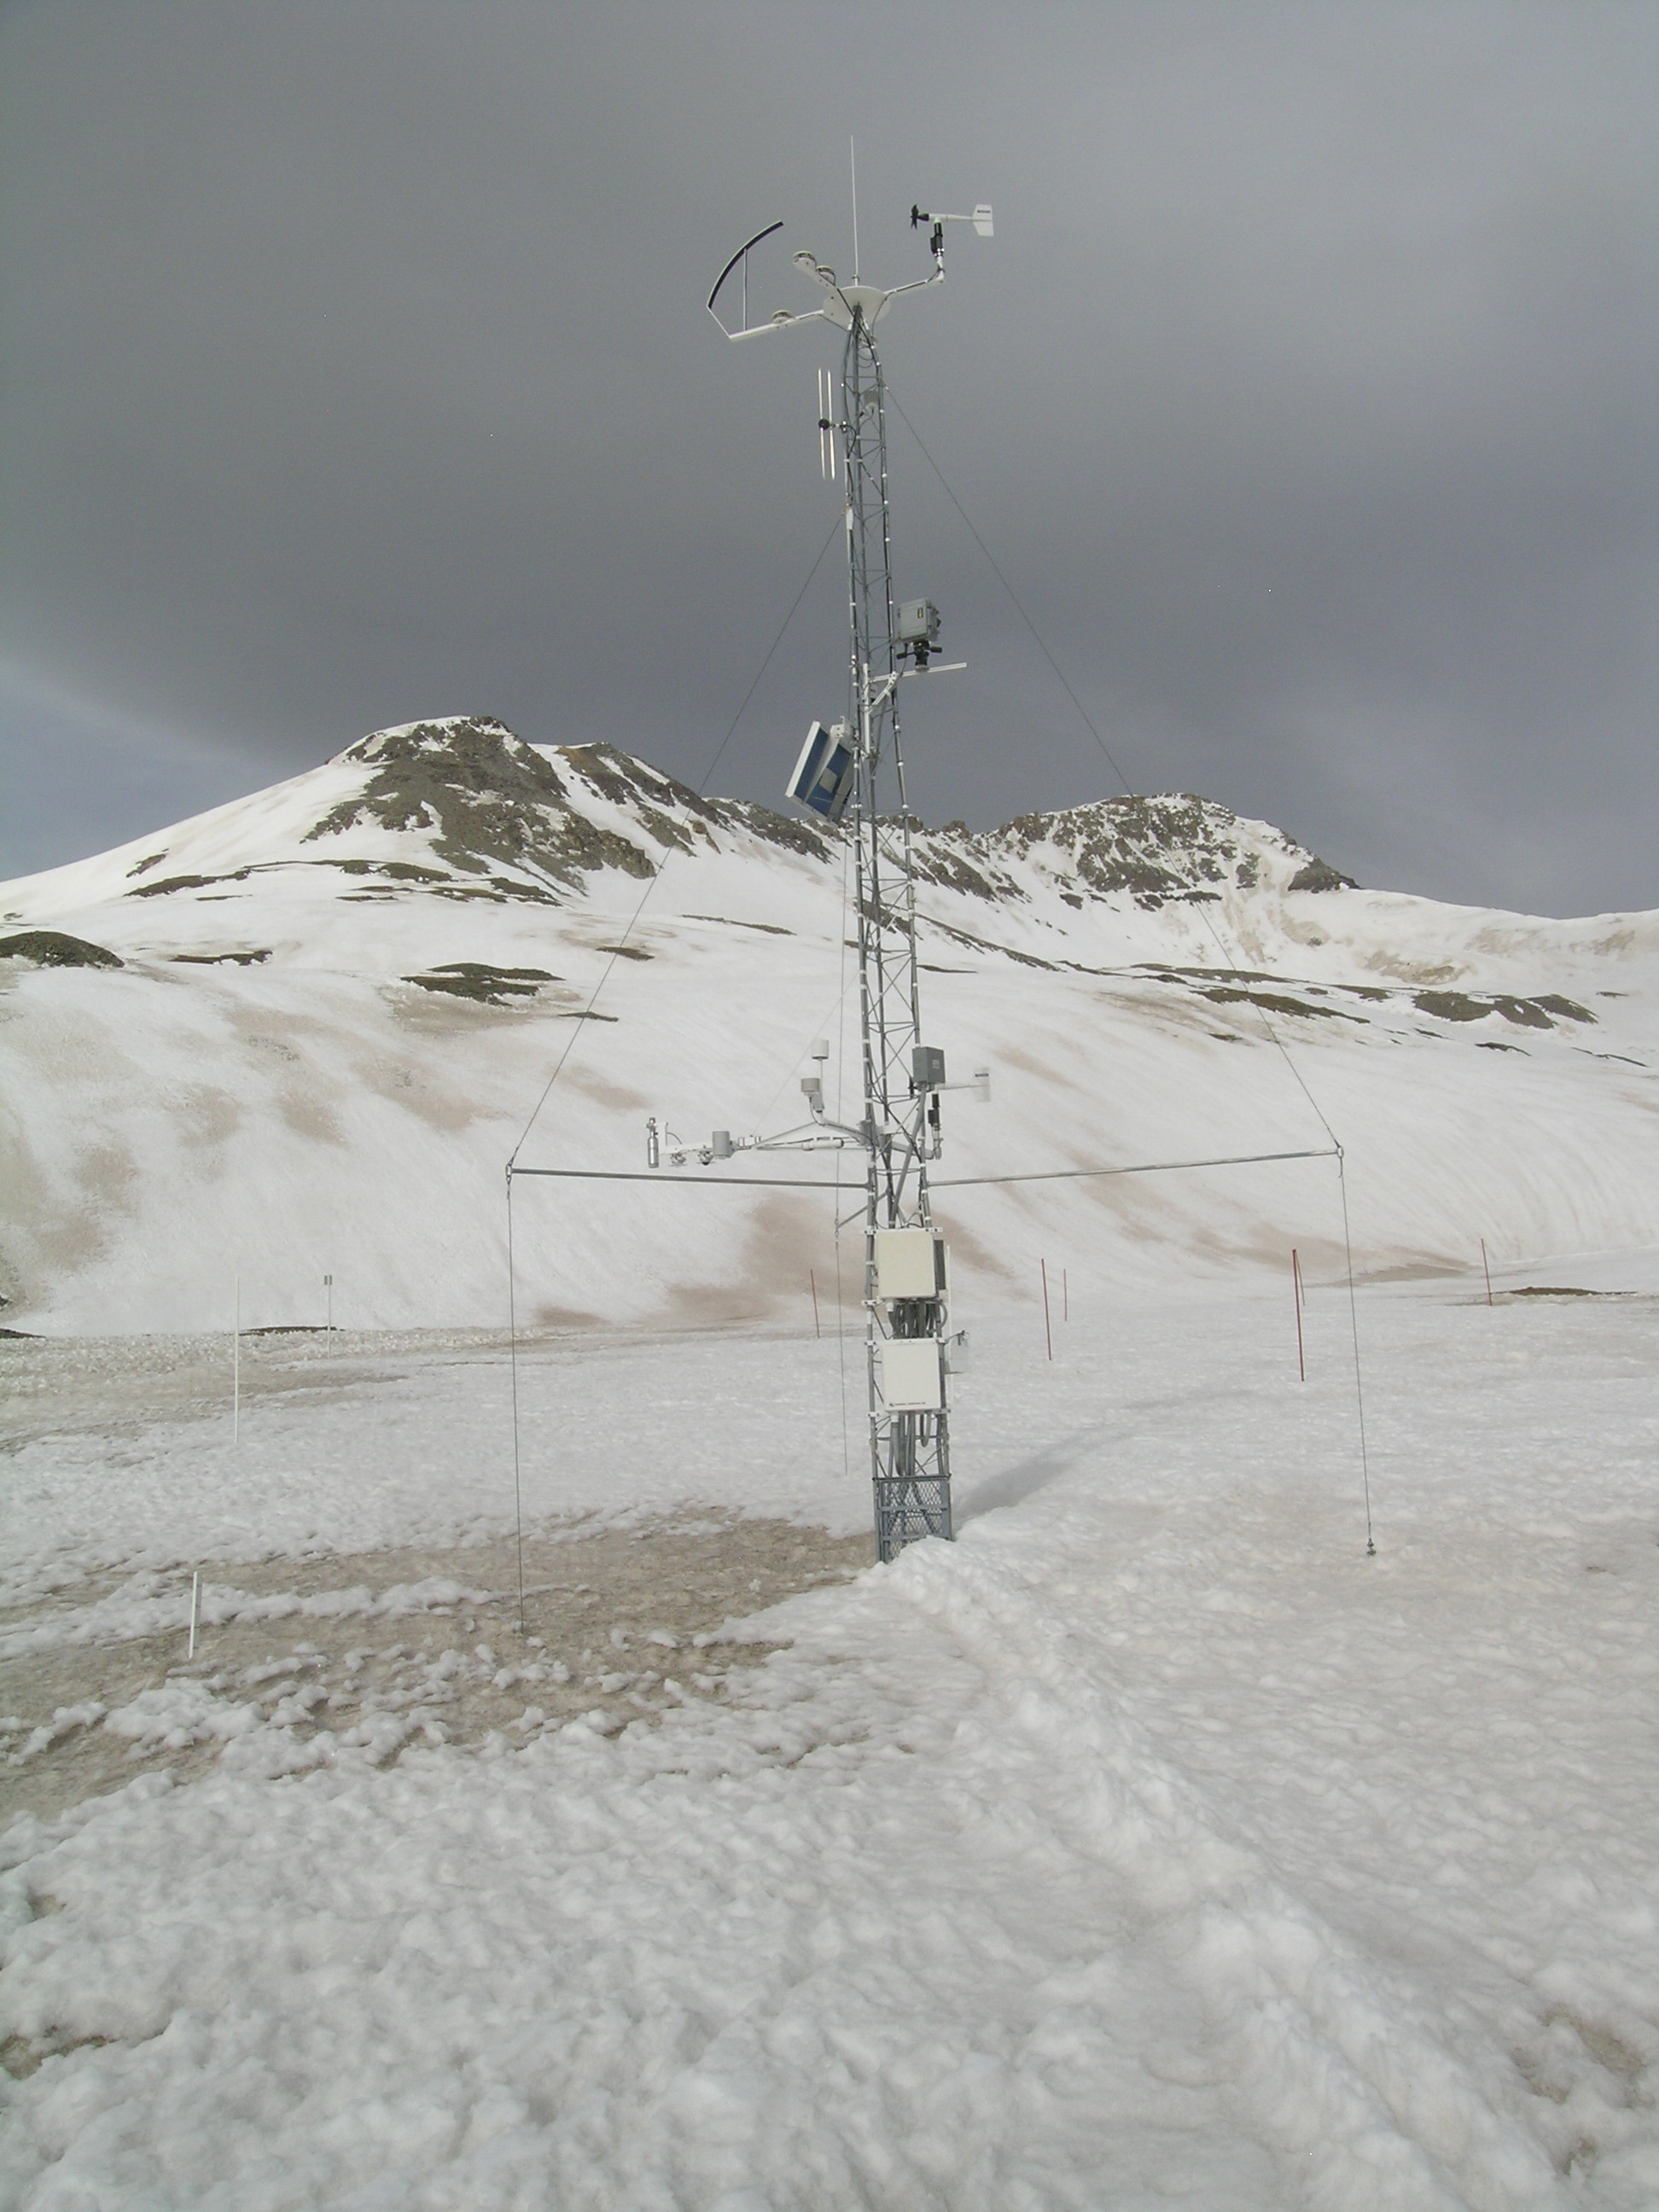
This report will focus on WY 2013 weather, snowpack, dust conditions, and snowmelt runoff at the Senator Beck Basin Study Area at Red Mountain Pass, shown above, providing context for local conditions observed at the ten other CODOS program monitoring sites, as described in the following summary reports:
- Park Cone WY 2013 Summary – upper Gunnison River basin
- Spring Creek Pass WY 2013 Summary – upper Rio Grande River watershed
- Wolf Creek Pass WY 2013 Summary – S. Fork Rio Grande and upper San Juan River basin
- Hoosier Pass WY 2013 Summary – Blue River
- Grizzly Peak WY 2013 Summary – Snake River
- Berthoud Summit WY 2013 Summary – Fraser River
- Willow Creek Pass WY 2013 Summary – Willow Creek
- Rabbit Ears Pass WY 2013 Summary – upper Yampa River
- McClure Pass WY 2013 Summary – upper Crystal River and Muddy Creek watersheds
- Grand Mesa WY 2013 Summary – Plateau Creek and Surface Creek
Dust LOg
Of the ten observed dust-on-snow events during Water Year 2013, we recorded two exceptional events (D6 of April 8-9 and D8 of April 14-17) that, in conjunction with the other eight events, and in light of recent new research, represent an escalation in dust impacts on the Colorado snow system. Those two events produced new extremes in mass deposition and dust storm duration.


D6 D8
Putney Study Plot hourly wind speed and direction data for D6 (left) and D8 (right) dust-on-snow events of Water Year 2013. Direction data are grouped in 22.5° sectors and speed subdivided into six classifications, including “calm”. Concentric rings show the percentage of contribution, for the entire period, of a particular vector (i.e., due south) and/or speed group within a sector.
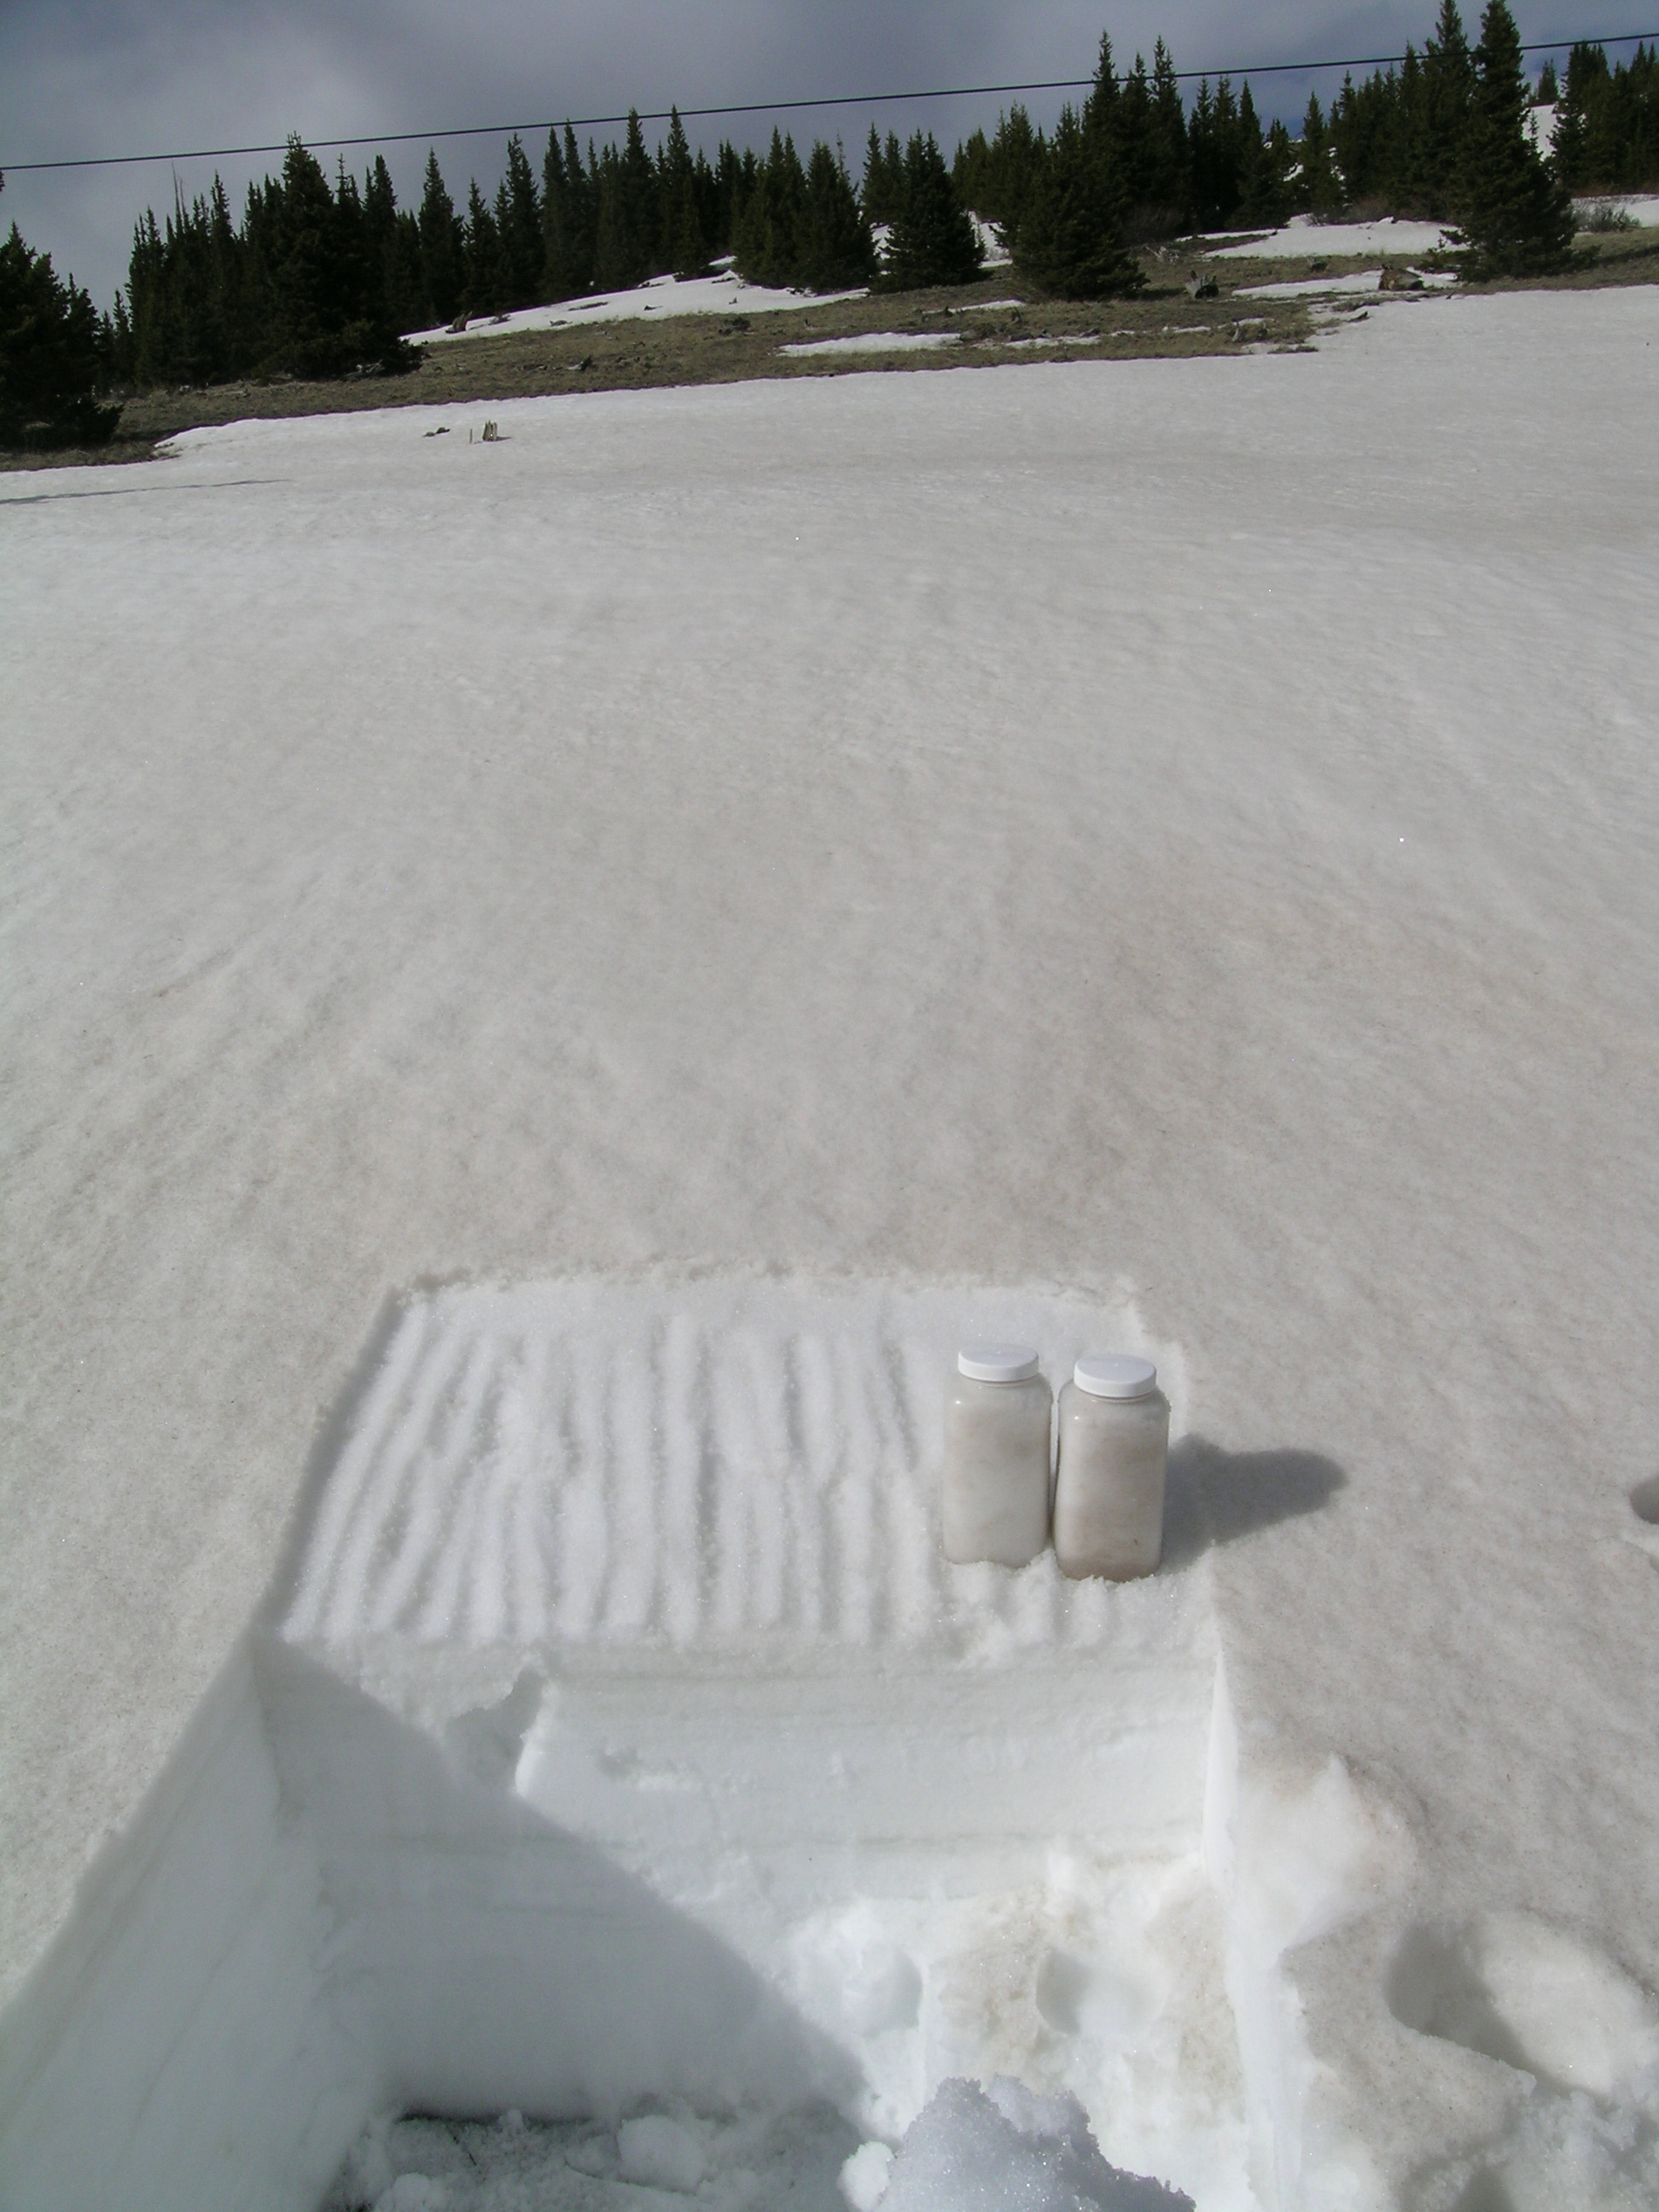
As feasible, CODOS captures discrete 0.5 m2 samples of each dust deposition from the snowpack at the Swamp Angel Study Plot in Senator Beck Basin, collecting all of the snow and dust and then bottling that sample for drying and weighing by our USGS partners in Denver. Our April 9 CODOS Dust Alert for event D6 illustrates the actual sample collection for D6. It was clear, as we sampled, that this was an exceptional dust layer.
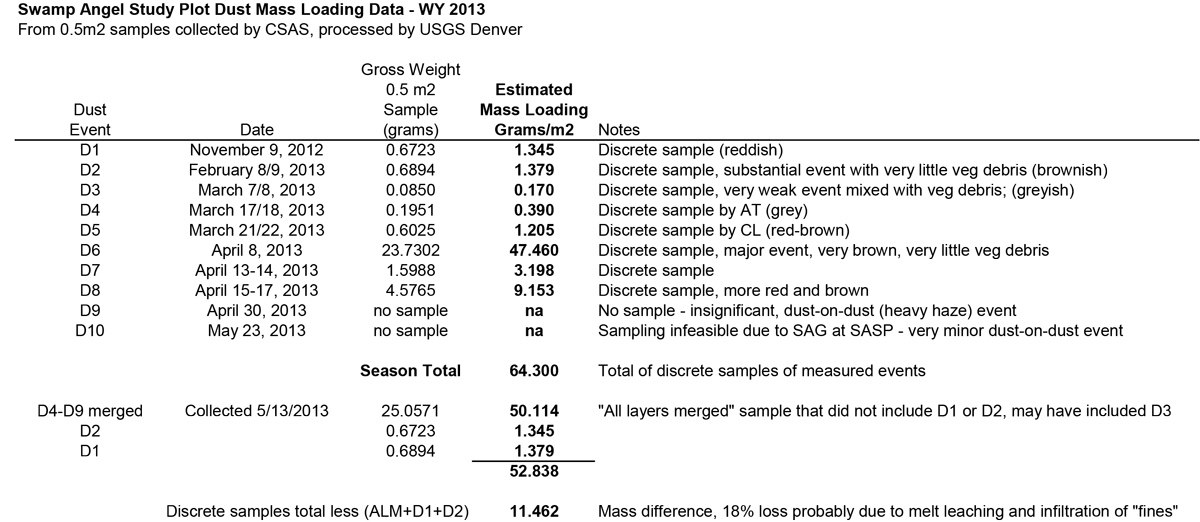
At over 47 grams per square meter, event D6 deposited several times more mass of material than any other single dust event we've ever observed at Senator Beck Basin, since we began in 2002/2003, and even more than the total deposition during any prior season, except perhaps WY 2009. Event D6, delivered on southerly winds in conjunction with winter Storm #19, brought 74% of all of the dust-on-snow we received at Senator Beck Basin this season (by weight) and was particularly dark in color. Unfortunately, storm cloud cover and then darkness precluded the capture of satellite imagery of this event in progress. At just 16 hours in duration, event D6 was not a particularly long dust (or winter) storm. However, the intensity of the deposition was unprecedented, at Senator Beck Basin. Interestingly, subsequent D6 layer observations at our ten other CODOS monitoring sites found the layer present as far away as the Front Range but at much lower intensity, even at the sites closest to Senator Beck Basin. It appears, then, that the wind field associated with event D6 strongly favored much higher rates of dust ‘precipitation’ here in the western San Juan Mountains, ‘dumping’ much of the dust load before delivering the remainder to CODOS sites farther north and east. Nonetheless, even at lower intensity, D6 was a significant event, statewide.
In contrast to the winds associated with D6, event D8 sustained very high average wind speeds, in a very narrow directional field, with palpable dust in the air for some 60 hours. However, despite that long duration, D8 was just the second-most intense dust event of the year at Senator Beck Basin, depositing over 9 grams/m2 (still establishing D8, by a wide margin, as the second largest event in our record). However, farther north and east and particularly in the Front Range, the D8 layer was often more intense than D6 and was the heaviest dust layer in the snowpack. We hypothesize that the very strong and sustained southwesterly wind field of D8 may have allowed only a small fraction of the suspended dust particles to ‘precipitate’ here in the western San Juans and, rather, carried most of its dust load past Senator Beck Basin. Interestingly, event D3 of March 5-8 was a slightly longer event than was D8, but precipitated the least amount of dust of the WY 2013 events. Soil conditions in the Colorado Plateau, following a series of weather events in late February and early March, apparently did not enable significant dust mobilization during D3.

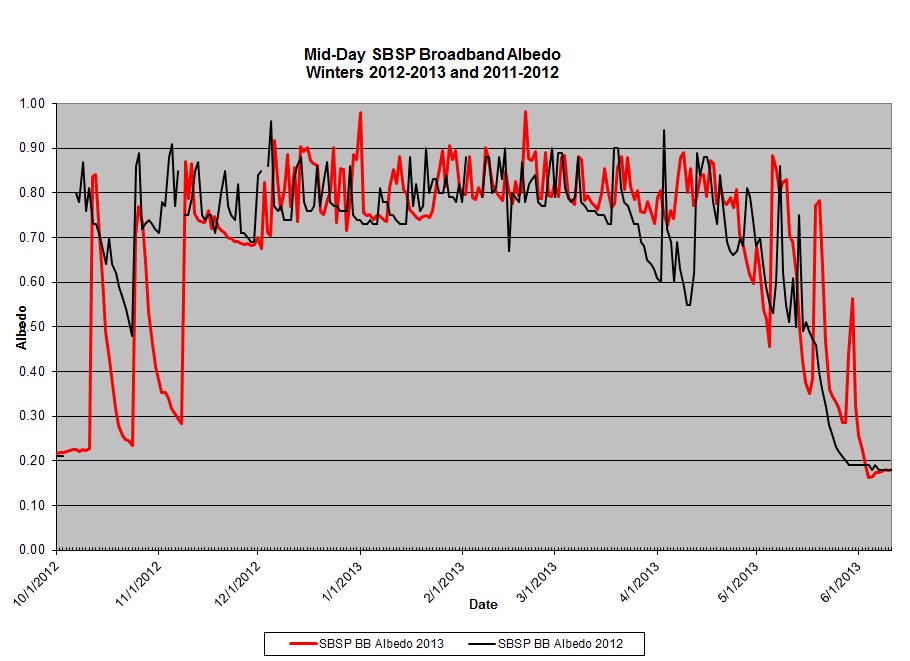
Plots of “broadband” snow albedo from 1200-1300 hours each day of WY 2013 (red) and WY 2012 (black) at the Swamp Angel Study Plot (SASP) and Senator Beck Study Plot (SBSP) in Senator Beck Basin Study Area. Gaps in the data at SASP represent days during which snow covered the up-looking “broad band” pyranometer measuring incoming, short-wave radiation (and SASP sensors were being recalibrated in fall 2013). Wind keeps the SBSP up-looking sensor clear of new snow. Data at the extreme ends of the plots represent the albedo of bare soil or vegetation on the ground, in the 0.15 to 0.20 range. Broadband albedo is calculated as the ratio of measured solar radiation reflected off the snowpack surface to incident (incoming) solar radiation; these measurements are not corrected for snow grain size effects or for slope and aspect of the reflecting snow surface (~3-4° NE at both sites).
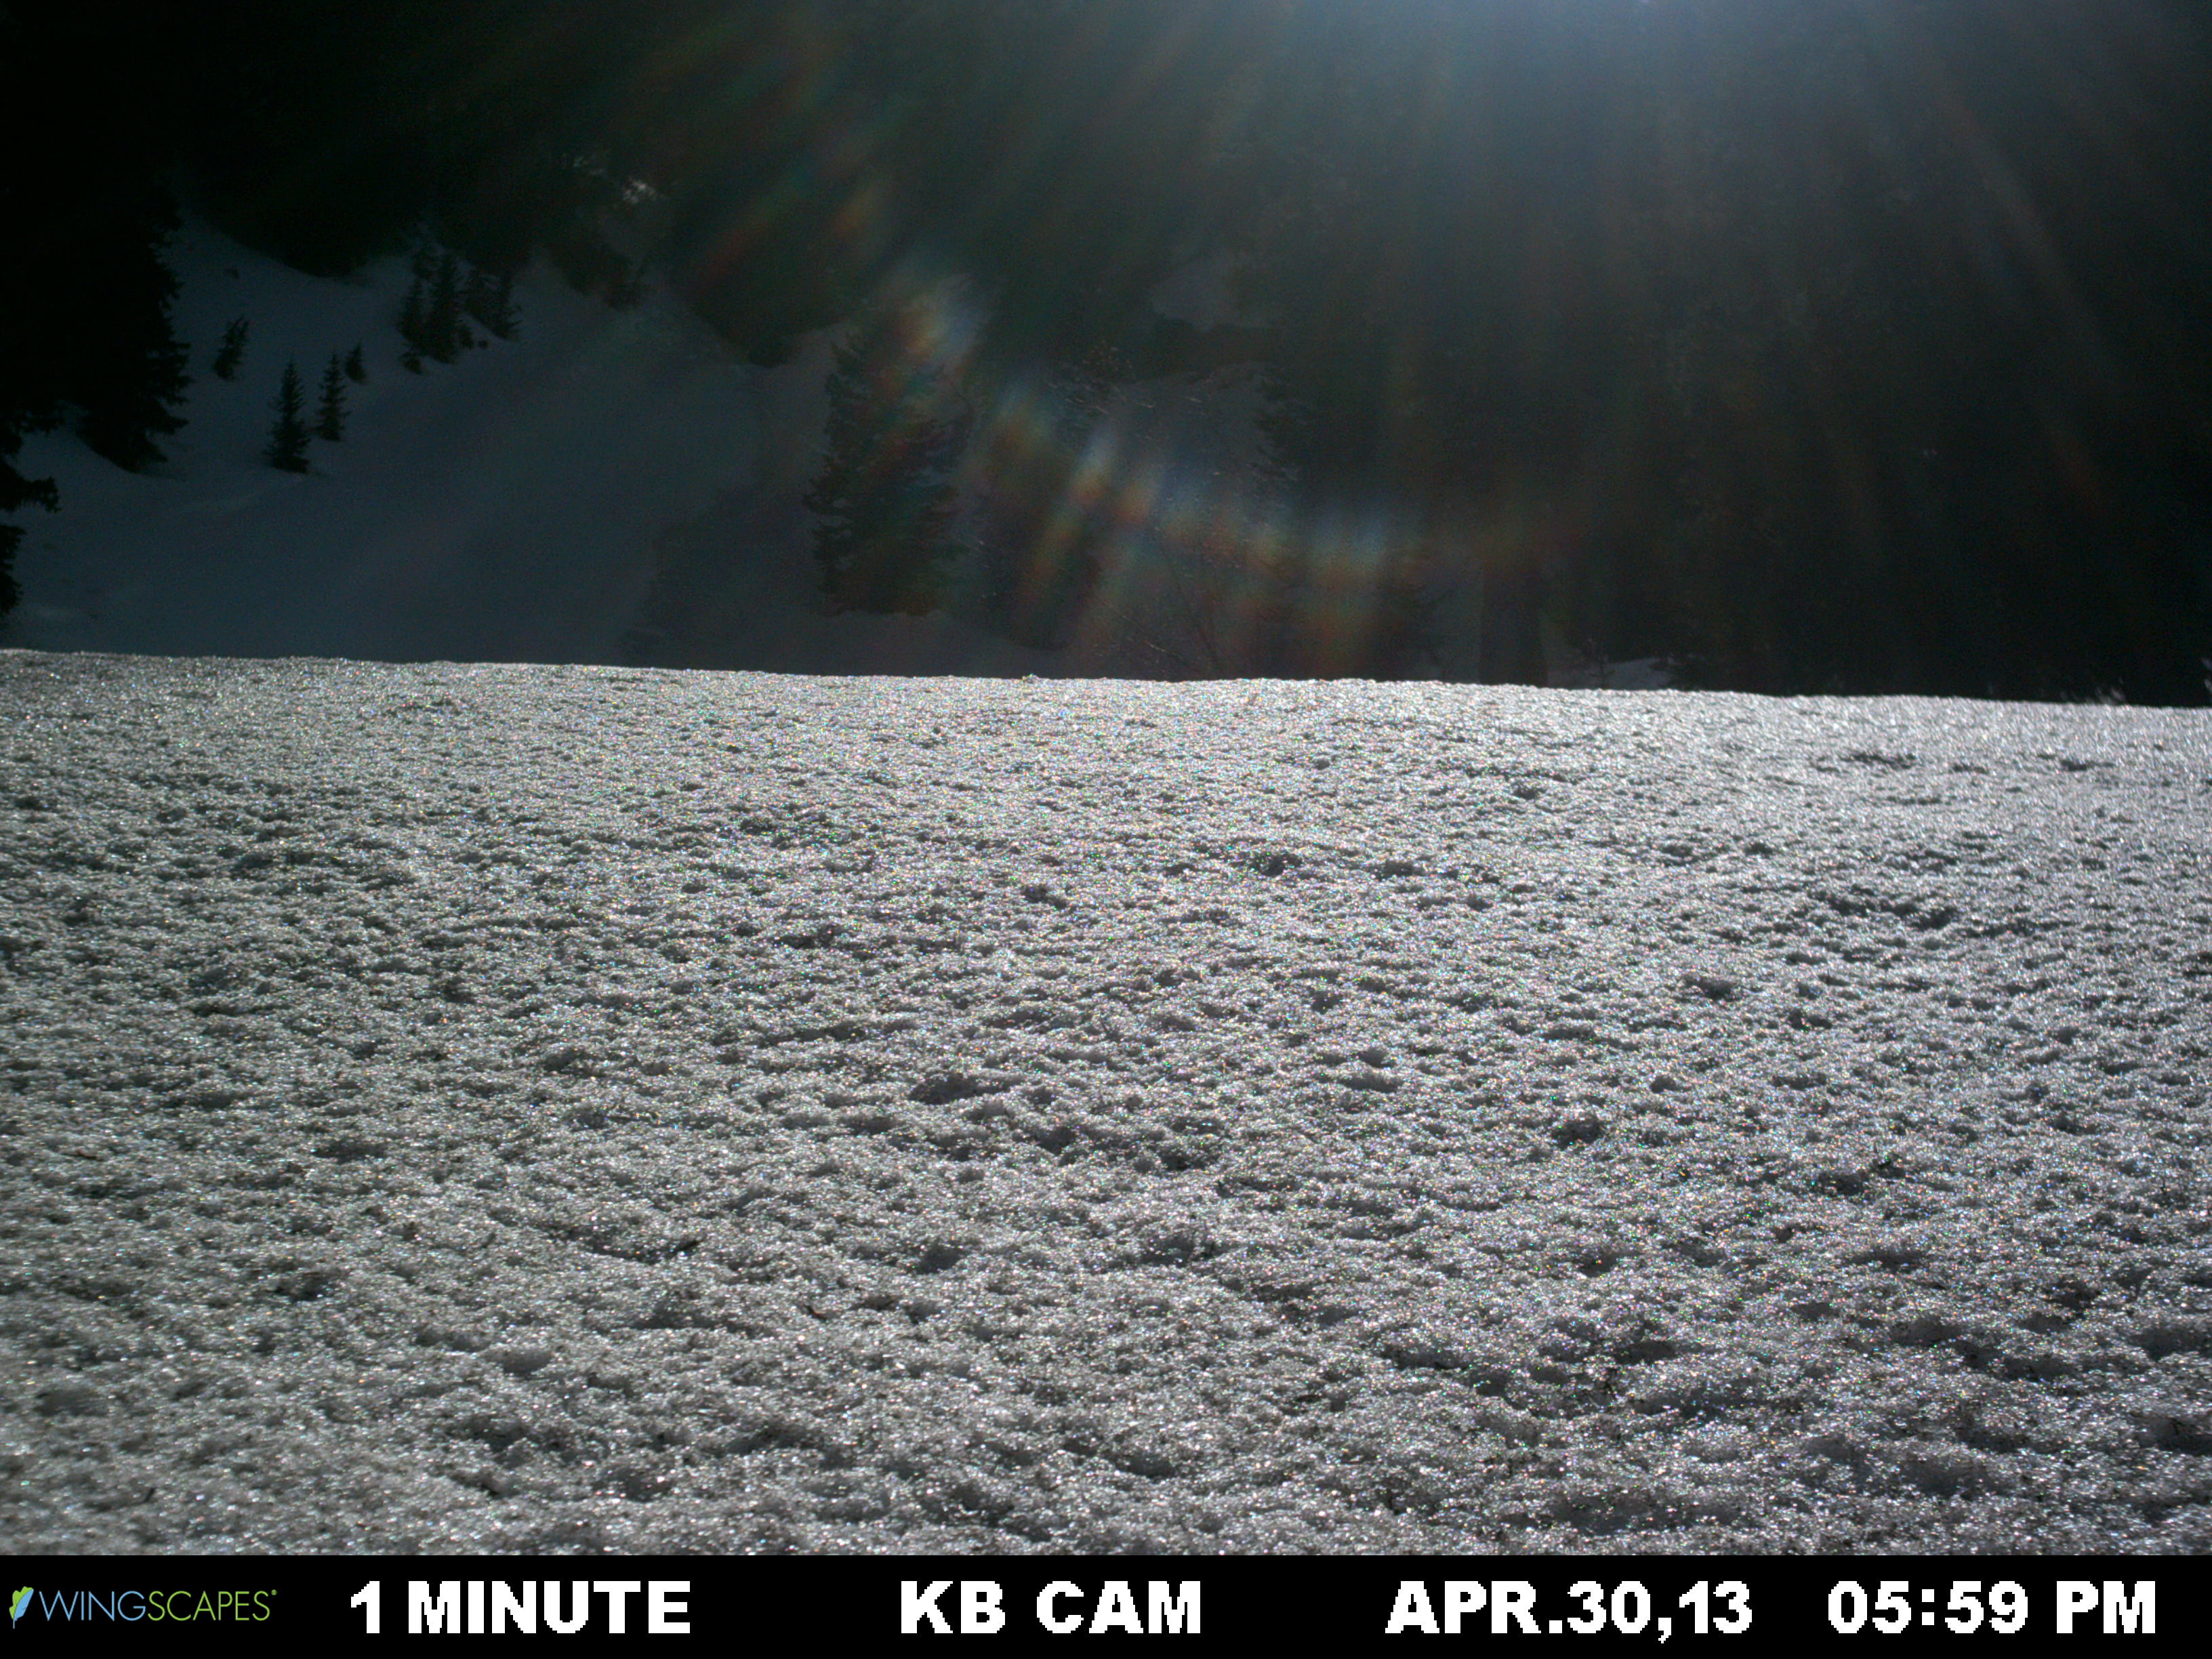
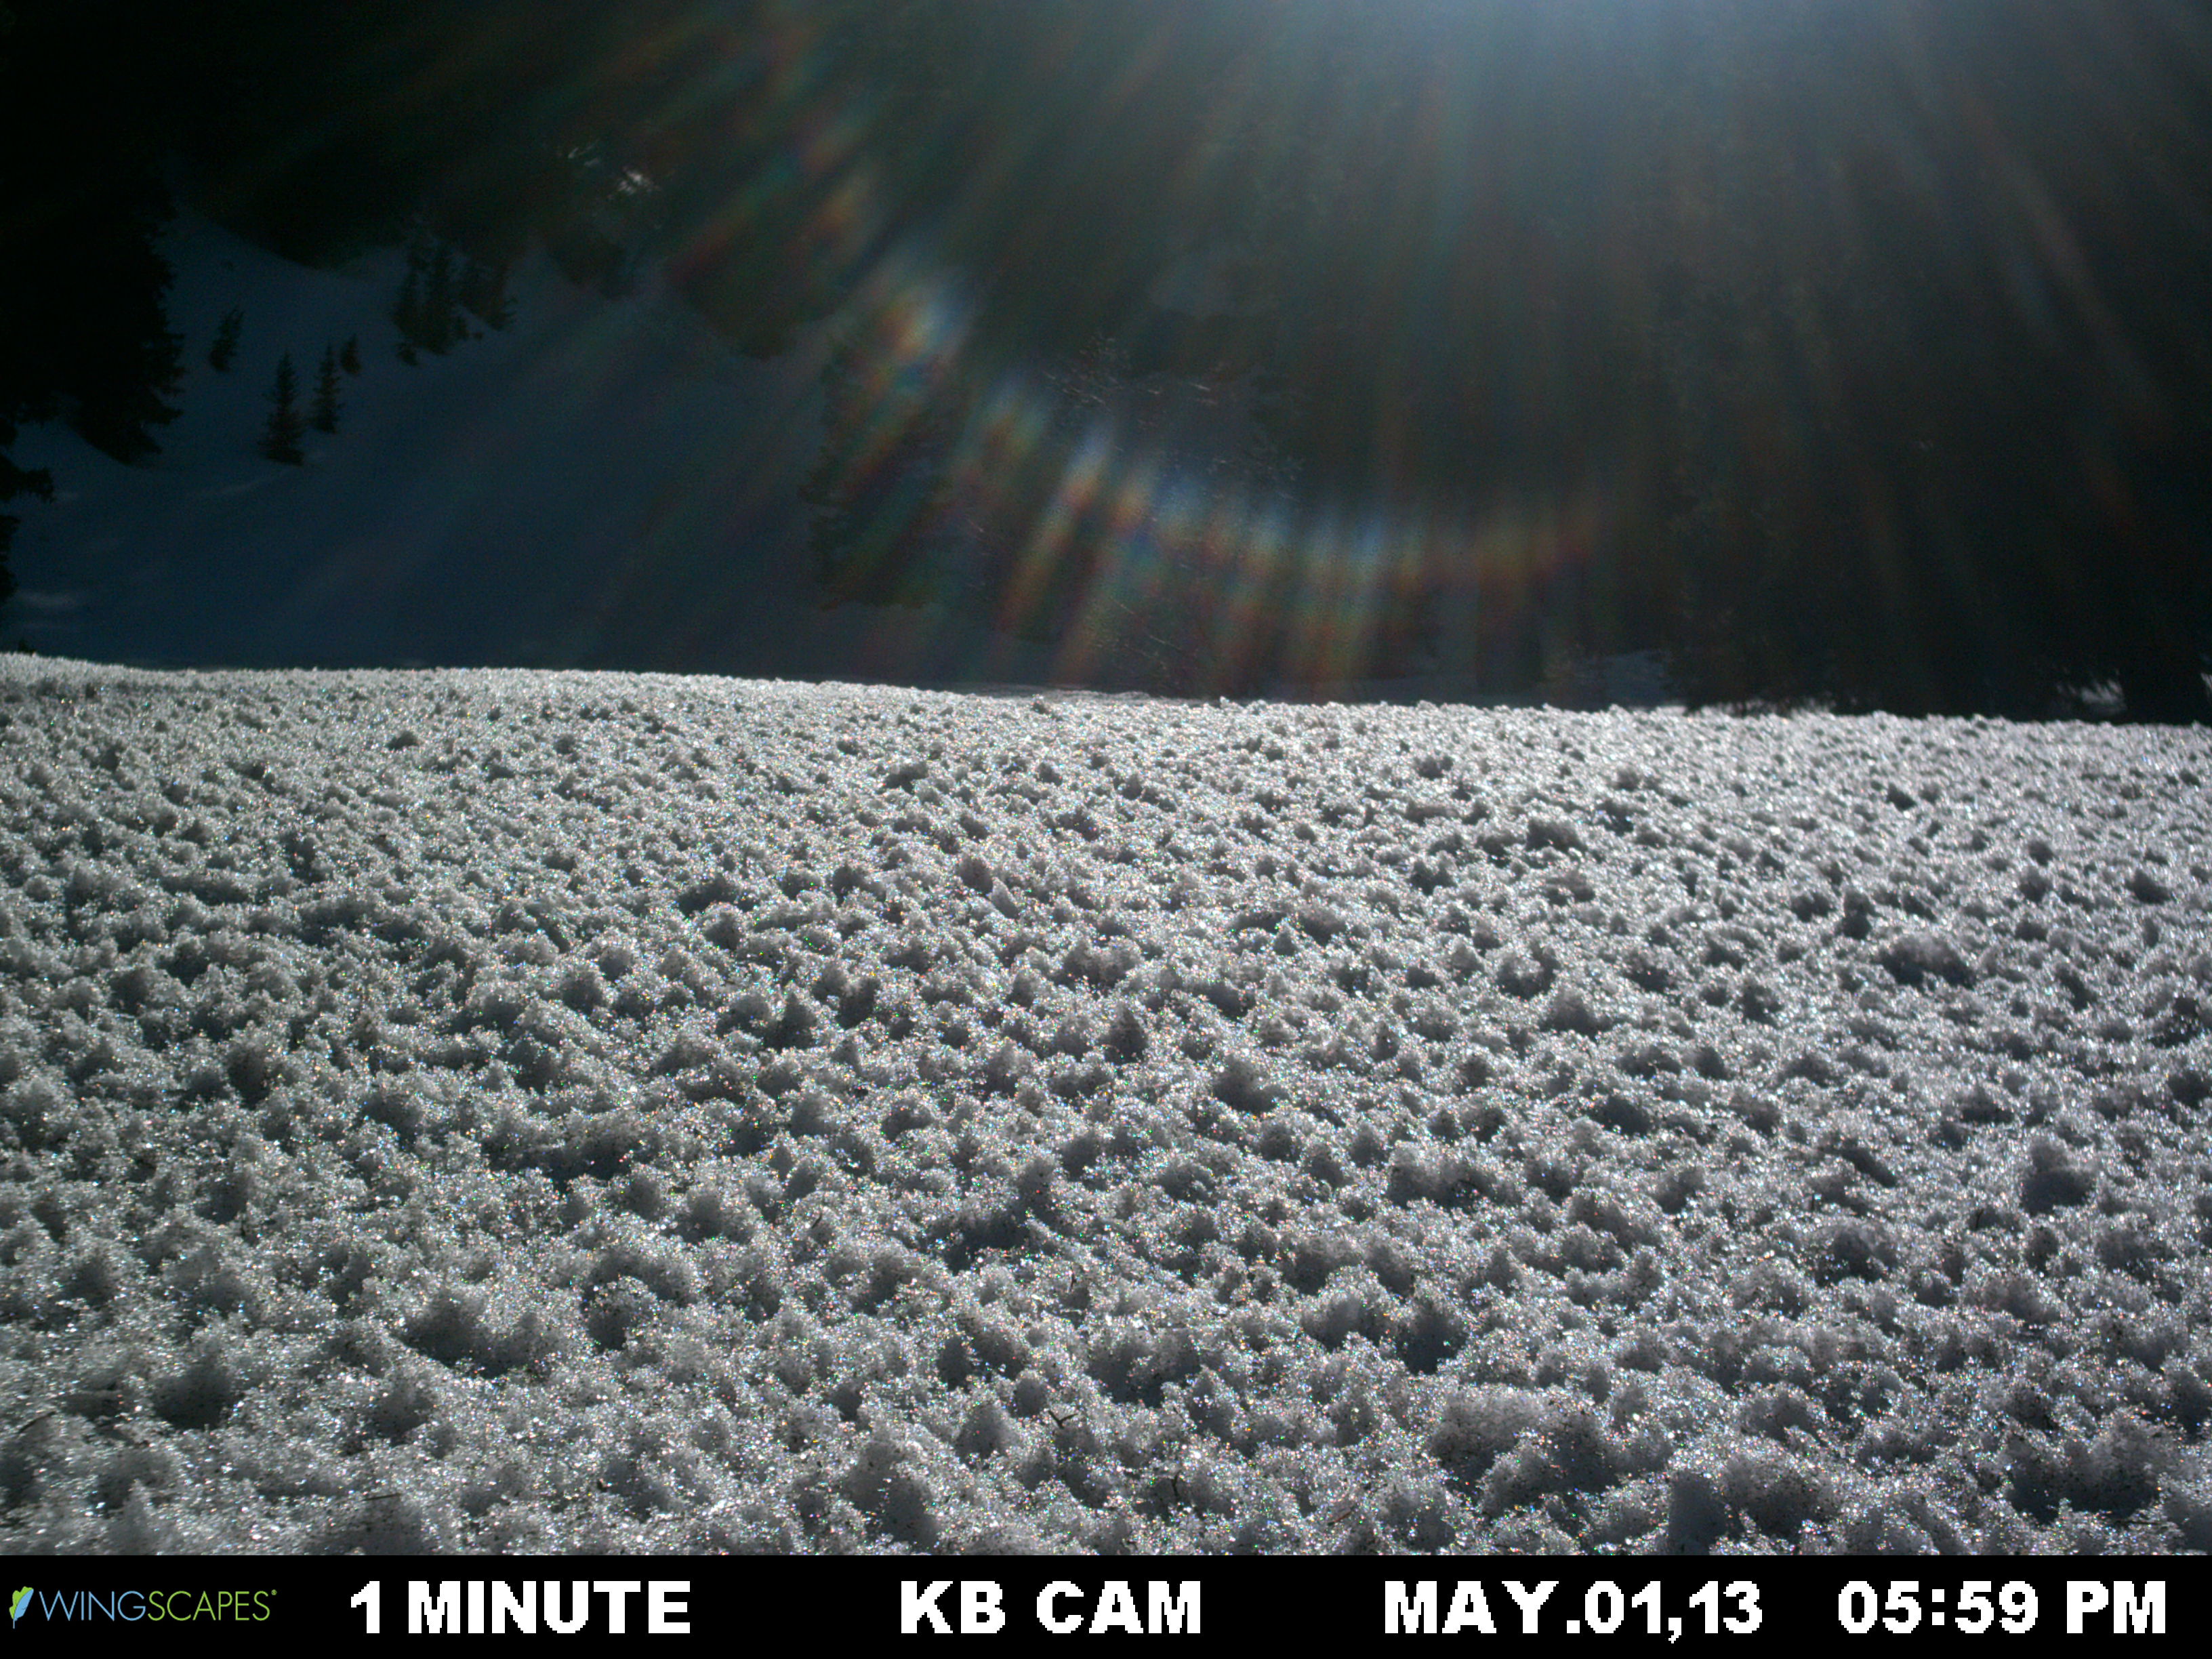
Given those two exceptional dust events, total WY 2013 dust loading at Senator Beck Basin was very high, even exceeding the “Martian Winter” of WY 2009, so-named for its red dust storms. Corresponding reductions in snow albedo (snowpack reflectivity) were measured at both the Swamp Angel and Senator Beck Study Plots at Senator Beck Basin as the season’s dust layers appeared at the snowpack surface. The graphs above depict mean “broadband” albedo for the hour from noon to 1 PM, when the sun was highest in the sky. Dust layers D6 and D8 had the greatest impacts on albedo in WY 2013, particularly after those layers merged at the snowpack surface, as seen in the photos below. Broadband albedo values fell to 0.30 (30% reflectance) when dust event D8 first emerged at the top of the 1 meter snowpack at Swamp Angel Study Plot on May 1, 2013, and to 0.35 (35%) when D8 emerged at the top of an 0.80 meter snowpack at Senator Beck Study Plot on May 17. Merged D8/D6 values were even lower. Sudden increases in albedo in April and May correspond to fresh, clean snowfalls, but those layers of new snow were short-lived and dust quickly re-emerged.
In contrast to WY2013, when albedo values remained comparatively high in March and early April, WY 2012 albedos began immediately falling at on March 1, with dust exposed at the snowpack surface and only a single snowfall over the entire month, briefly restoring a higher albedo.
Winter Storms and wind
from CSAS Storms and Precip Data:

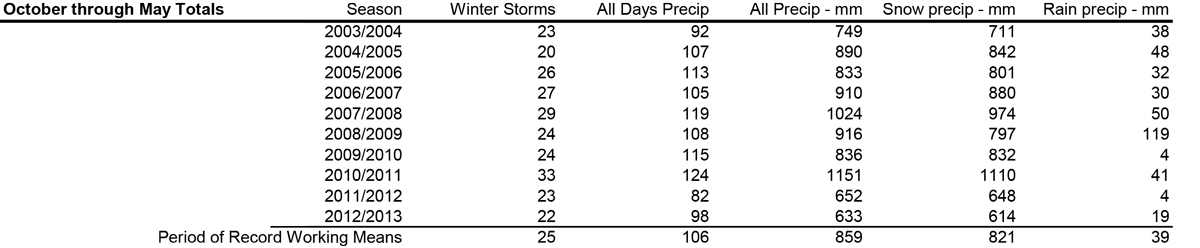
The tables above present summary statistics for the ten winter seasons in our period of record. Since and including the winter of 2003/2004, our Senator Beck Basin Study Area has experienced between 20 and 33 numbered winter Storms from October through May, with a working mean of 25 Storms per season. We have also observed 3 Storms in June.
During the past three winters, Senator Beck Basin has received a declining number of winter storms and Water Year 2013 was the driest winter season (October-May) in our 10-year period of record, with the second lowest number of winter storms. The Center for Snow and Avalanche Studies has maintained a log of “winter storms” since the winter of 2003/2004. Winter Storms are defined as a snow precipitation event containing at least 12 mm (~ 0.5 inches) of water equivalent, as measured in 1 mm increments at the Swamp Angel Study Plot using an ETI precipitation gauge, and with no break in precipitation greater than 12 hours. A number of storm parameters are logged, including allocations of storm precipitation to rain or snow in early and late winter. Weather events which meet the Storm criteria are sequentially numbered throughout the season, but all precipitation is, of course, recorded and tallied. The complete CSAS Storms and Precip Data record presenting detailed and summary Storm datasets and graphs is contained in an Excel workbook linked on our website.
Six of the WY 2013 dust-on-snow events logged at Senator Beck Basin, including the major D6 and D8 events, occurred in conjunction with winter storms and snowfall (events D1, D2, D5, D6, D7 and D8); the other three dust events were “dry”, with no associated precipitation. That preponderance of “wet” dust events is in sharp contrast to WY 2012, when 9 of the 12 total dust events fell “dry” in conjunction with large-scale weather systems producing strong wind fields but delivering no precipitation – i.e., drought with wind. Thus, even though winter 2012/2013 produced one fewer winter storms than winter 2011/2012, and slightly less total precipitation, the vast majority of WY 2013 dust was delivered with precipitation during storms that traversed Colorado Plateau dust source areas, some delivering precipitation there as well. Pre-frontal winds can mobilize these dust storms in the source area ahead of much of a given precipitation event, but soils must be sufficiently dry for that to occur. Clearly, the intervals between winter 2012/2013 Colorado Plateau storms was crucial, determining whether moistened soils could dry out enough between ‘wet’ storms to be available for the next pre-frontal wind field to mobilize. In contrast, during winter 2011/2012 many more of the Colorado Plateau synoptic scale “closed low” weather systems were dry, leaving soils readily available to pre-frontal (and other) winds to mobilize and deliver to Colorado as dust-on-snow.
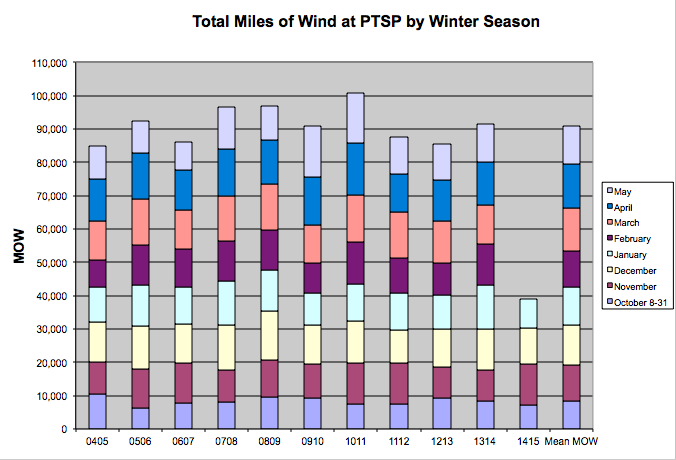
Cumulative “miles of wind” (MOW) passing through the Putney Study Plot, by month and winter season. One hour of wind averaging 30 mph at PTSP yields 30 miles of wind.
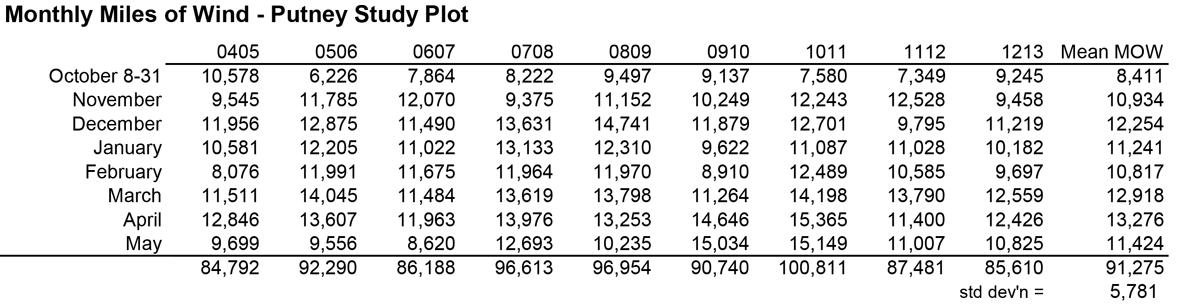
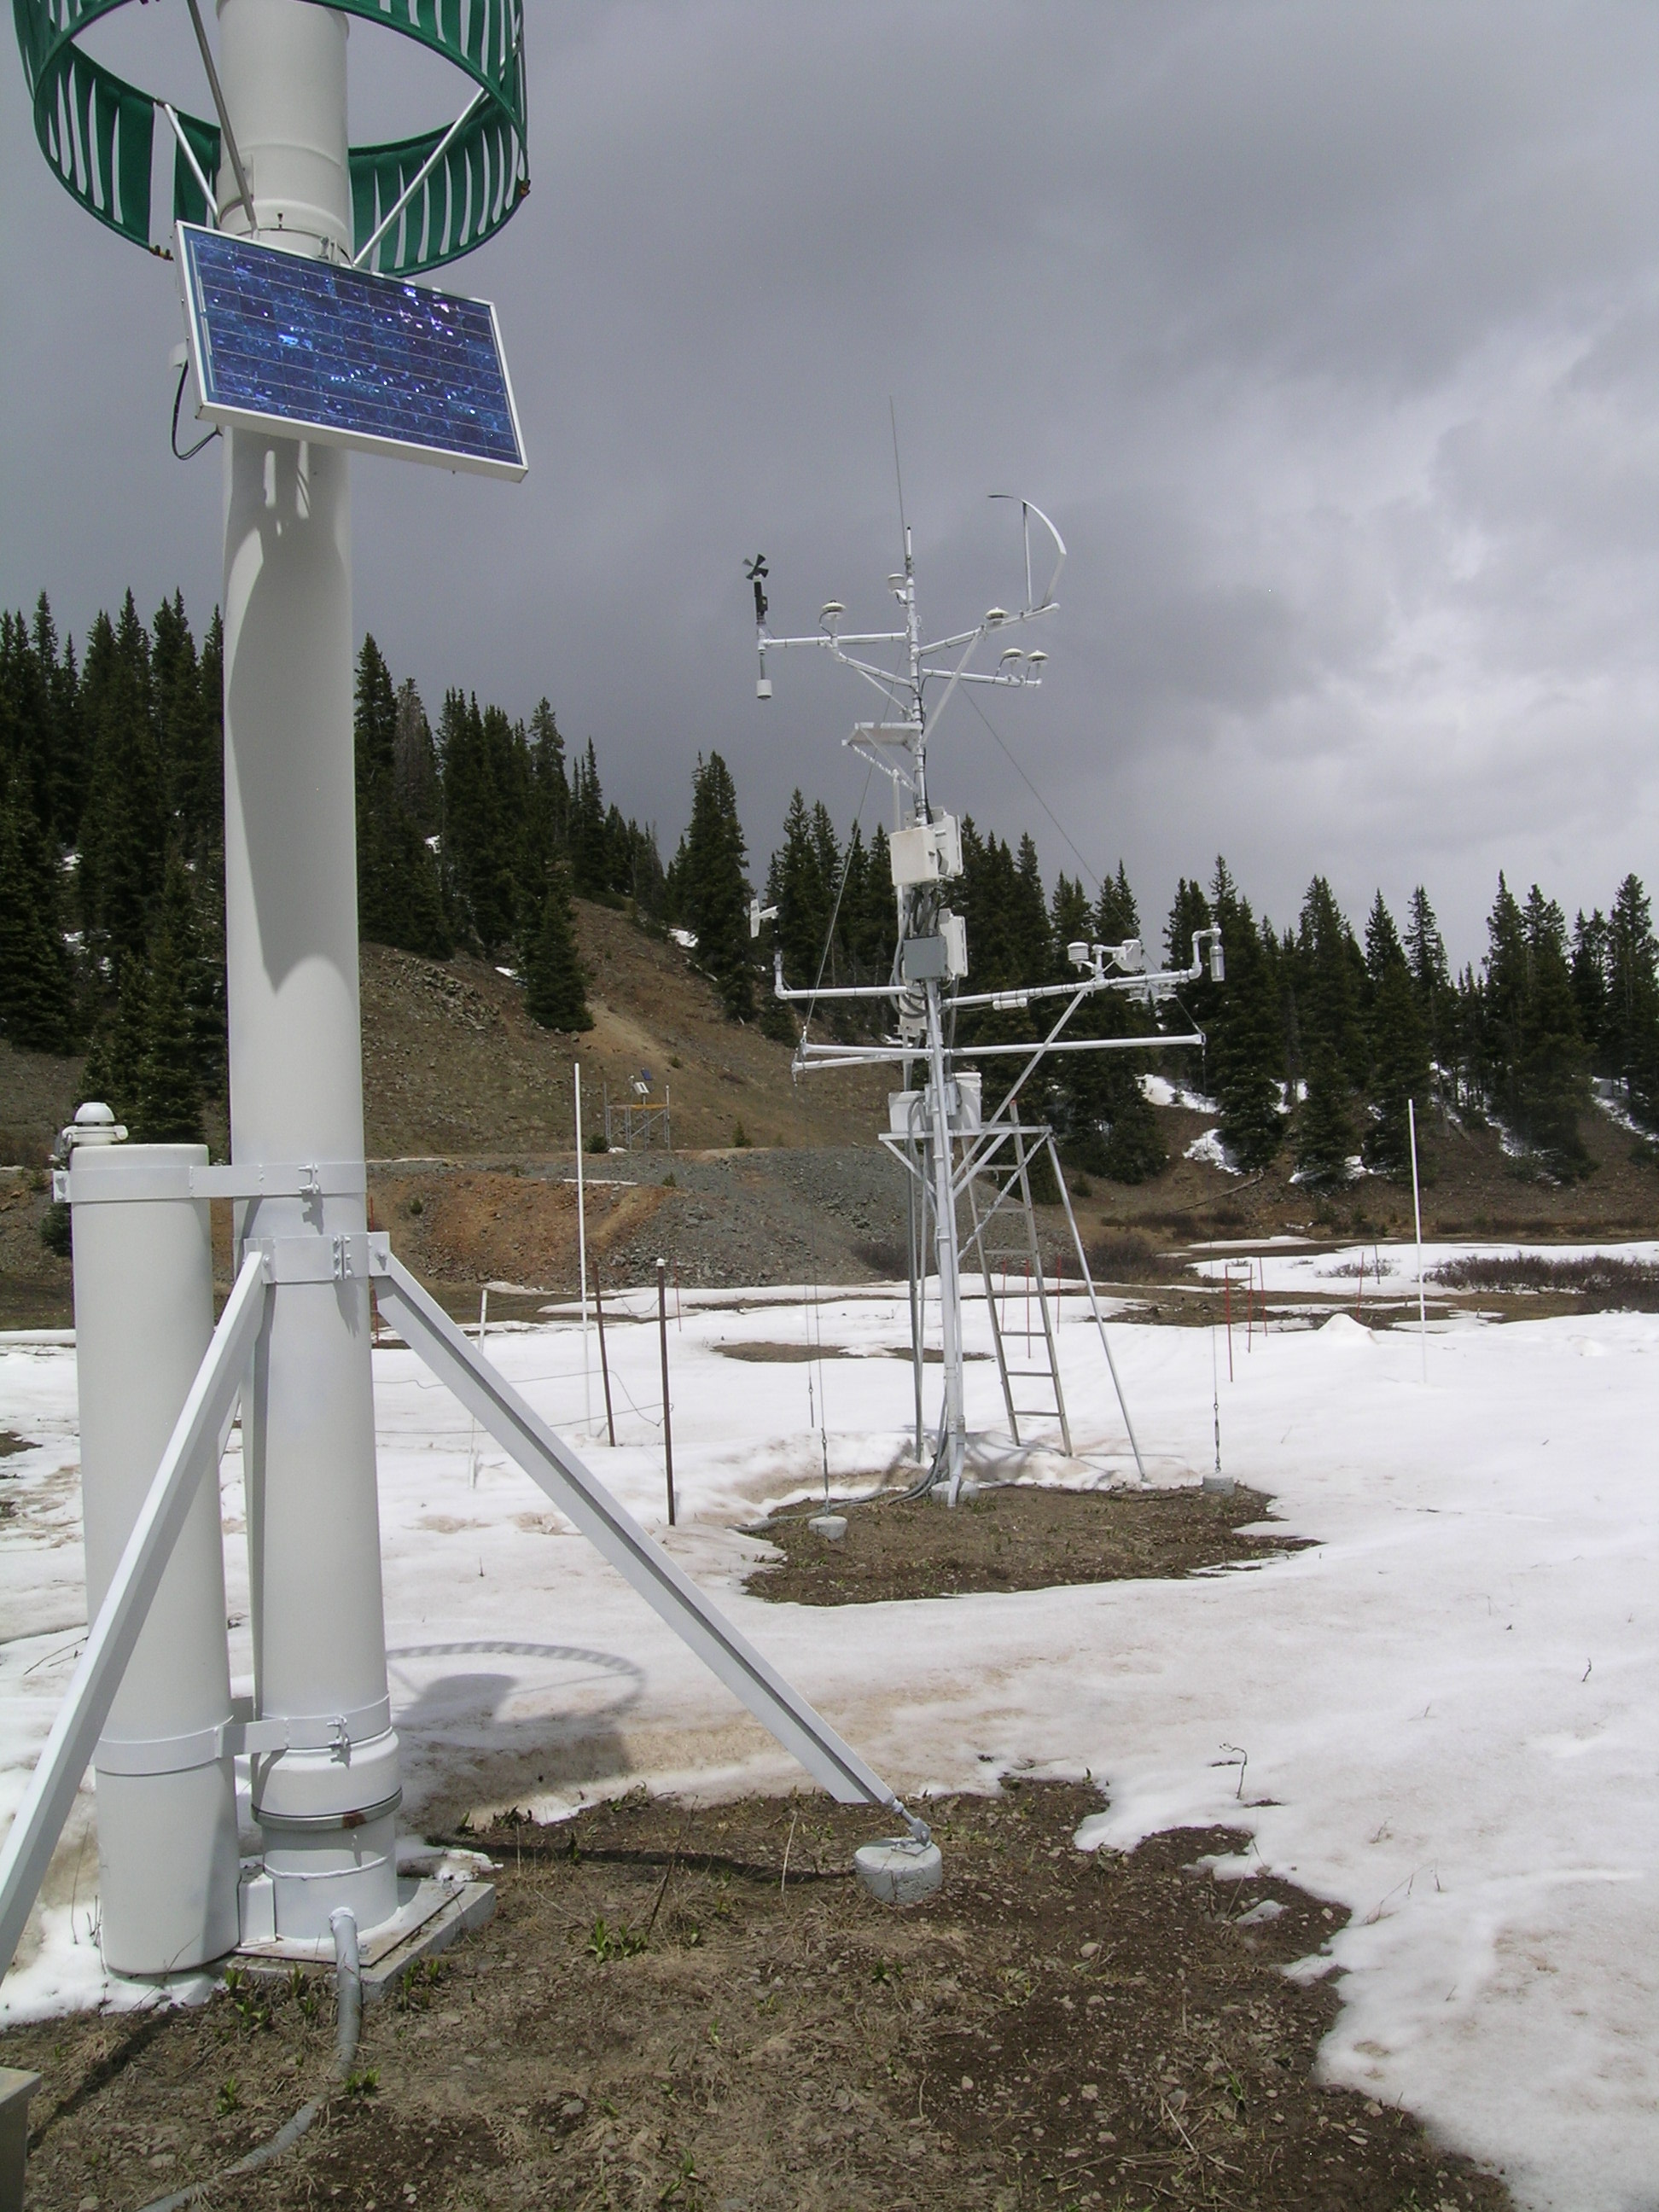
CSAS monitors wind behavior at the Putney Study Plot (PTSP), located on a ridgeline summit just east of Senator Beck Basin. Terrain effects on wind speed and direction, and air temperature and humidity, are minimized at that location and measurements of those parameters at PTSP are considered representative of general wind flow in the Red Mountain Pass locale, and of ambient air temperature and humidity at that 12,325’ elevation. Winter storms account for the majority of “miles of wind” at PTSP.
Over the 9 year period of record, the month of April has produced both the most wind, at 13,276 MOW, and the highest mean number of winter storms, at 4.1 storms per month. At an average of 129.2 mm precipitation per month, April is second only to December’s 134.6 mm per month. March is a distant 5th in precipitation, supporting the growing sense that “April is the new March” in the western San Juan Mountains, at least with respect to snowfall. However, March is second in mean MOW, close behind April.
March and April deliver a high proportion of Colorado’s dust-on-snow events. If March continues to be very windy but comparatively dry, March dust layers may be less frequently covered by clean snow and., therefor, remain exposed for longer periods. Those dust layers experience increased radiative forcing, hastening snowpack “ripening” by producing longer surface melt episodes with more free water percolating into the upper snowpack, eroding cold content. Such was the case in WY 2012, during the very dry March, with three dust-on-snow events variously exposed at the snowpack surface for prolonged periods.
Overall, winter 2012/2013 produced the second lowest total MOW in the PTSP period of record, slightly ahead of winter 2004/2005. However, March/April 2013, when the bulk of dust-on-snow events occurred, produced 24,985 total miles of wind, only 1% fewer MOW than March/April 2012. The long-duration dust event D8, from April 15-17, logged 61 hours of wind averaging 37.0 mph and D6 on April 8/9 averaged 25.5 mph for 16 hours, for a total of 2,665 MOW, 21% of the April total.SnowPack
SWE accumulation and ablation for Water Years 2012 and 2013, with dust-on-snow events shown as brown bars, by date (as observed at the Senator Beck Basin Study Area). The long-duration D8 event of April 15-17, 2013, is shown as a heavier bar. Note that not all dust layers observed at Senator Beck Basin were also found at other CODOS sites.
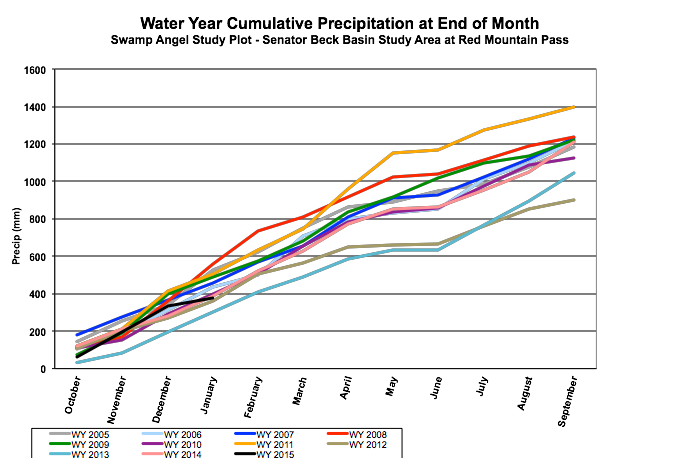
As was the case throughout most of the Colorado mountains, snowpack development began slowly in the western San Juan Mountains, quickly falling behind WY 2012. Winter Storm #1, November 9-11, 2012 (which also delivered dust event D1) was followed by almost a full month of dry weather but precipitation eventually resumed in mid-December. Despite a period of stormy weather and significant SWE gains in December (CSAS Storms #4-8), by New Years Day SWE at the Red Mountain Pass and Lizard Head Pass Snotels still lagged far below median levels and well behind WY 2012.
Early- and mid-January saw minimal gains and, even though finally catching up with WY 2012, SWE values still remained in the lower quartile of the period of record and would continue to do so for the remainder of the winter. After a strong surge in late January (CSAS Storms # 10, 11, 12), SWE accumulation then proceeded during February (CSAS Storms #13, 14, and 15) and March (Storms #16, 17, and 18). Dust layers D1 (November 9), D2 (February 8/9), D4 (March17/18), and D5 (March 21/22) were all clearly discernible in our March 22, 2013 snow profile #7 at the Swamp Angel Study Plot. Event D3 (March 6-8) had become too faint to observe. Snow temperatures in this profile were comparatively warm, at a mean of -3.5° C.
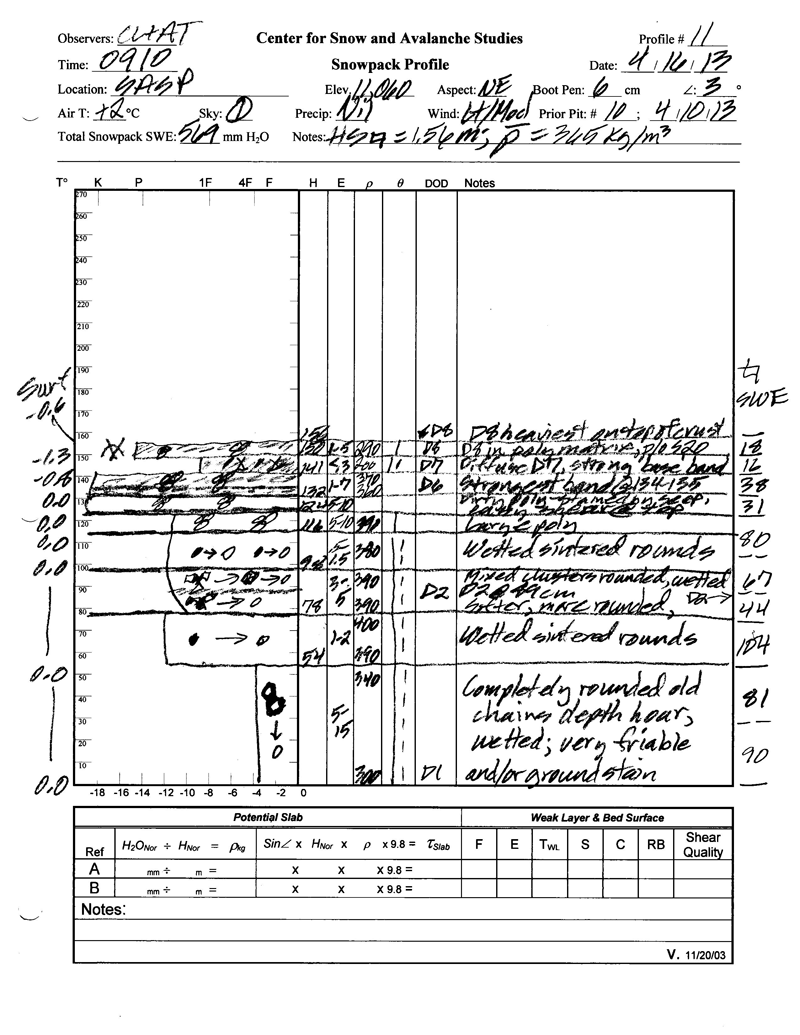
After a lull in precipitation in late March and early April, CSAS Storm #19 on April 8th delivered substantial snow as well as the extremely heavy dust event D6. Storms #20 and #21 followed with more snow as well as delivering, respectively, dust events D7 and D8. Our April 16 snow profile at Swamp Angel Study Plot, with event D8 still in progress, found a virtually isothermal snowpack and clear evidence of a significant snowmelt episode over the days preceding Storm #20, with layer D6 at the snowpack surface. That melt episode ‘pumped’ considerable heat down into the snowcover via melt water percolation (meeting geothermal energy rising upward from the ground) , and the initial phase of the snowmelt cycle was now nearly complete, at least in the lower elevations of Senator Beck Basin, with the snowpack warmed to near 0.0° C throughout. Once a snowpack’s cold content is fully ‘eroded’ and the snowcover is isothermal at 0.0° C throughout, subsequent solar energy absorbed in dust will be 'devoted' to actually melting the snowpack.
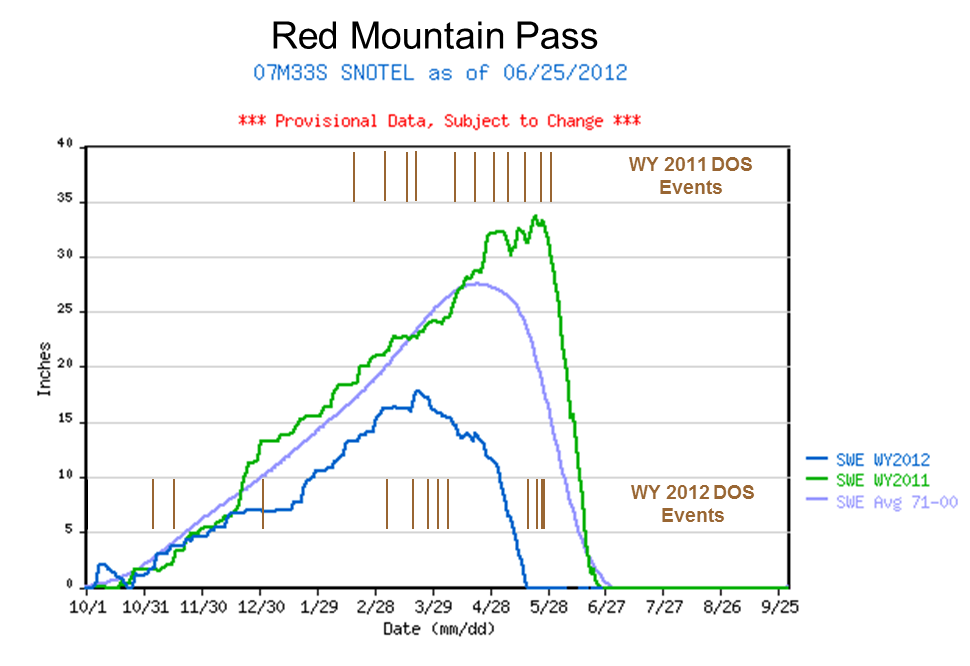
Peak SWE at the nearby Red Mountain Pass Snotel followed on April 26 at 19.6”, 1.8” higher than the WY 2012 peak but still 5.0” below the median peak SWE value of 24.6”. Peak SWE WY 2013 was on the median date of Peak SWE (April 26) but over a month later than peak SWE in WY 2012. At Swamp Angel Study Plot, where SWE is measured manually during snow profiles, we measured our highest SWE value, at 24.6”, in profile #12 on April 22, 2013. That 2013 peak SWE was 3.2” higher than the measured peak in WY 2012. As of April 22, the Red Mountain Pass Snotel had logged a total of 21.4” of precipitation for WY 2013; Swamp Angel Study Plot had logged 23.1” total for WY 2013. These differences in precipitation are likely the result of orographic precipitation on the north side of Red Mountain Pass delivering precipitation to Swamp Angel Study Plot but not reaching the Snotel site, almost a mile south of Swamp Angel Study Plot and on the south side of Red Mountain Pass. Differences in peak SWE reflect those differences in precipitation as well as differences in slope aspect of the sites, with Swamp Angel Study Plot sloping slightly northeast while the Snotel site is on west-facing terrain. Finally the 1.5” (6.5%) difference at Swamp Angel Study Plot between peak SWE and total precipitation on the date of peak SWE, with peak SWE greater than total precipitation, suggests either undercapture of snowfall by the precipitation gauge, or some wind redistribution of snowcover on the ground, or some error in the SWE measurement, or some combination of all these factors.
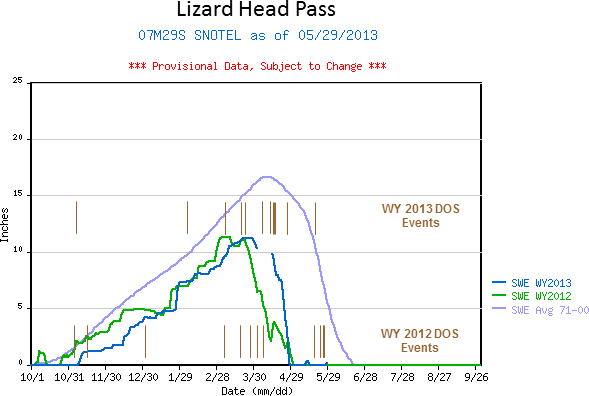
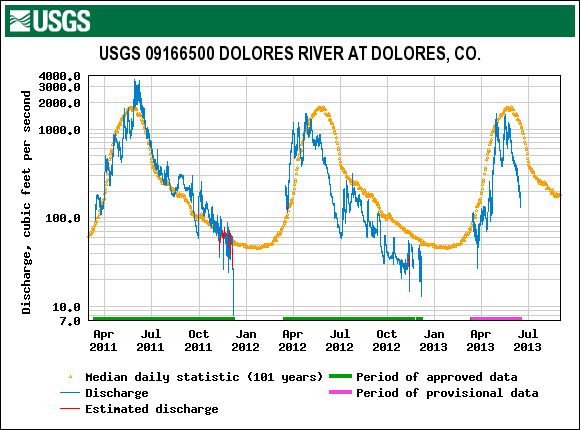
Meanwhile, the Lizard Head Pass Snotel located in the Dolores River headwaters, located just 14 miles southwest of Senator Beck Basin and Red Mountain Pass, reached peak SWE almost a month earlier, on March 25, at 11.2”, just 0.1” less than peak SWE 2012 but 5.2” below the median peak SWE for that site. Peak SWE 2013 at Lizard Head Pass was two weeks later than in WY 2012 but 11 days earlier than median peak SWE.
Snowpack ablation was well underway by late April and early May in Senator Beck Basin, enhanced by the emergence of dust layer D8 and the merging of layer D8 with layer D6. Our fully isothermal snow profile at Swamp Angel Study Plot on April 30 found that merging of D8 with D6 underway, and a net loss of 1.6” SWE since April 16. Our snow profile #15 at the higher elevation Senator Beck Study Plot on May 5 also revealed a virtually isothermal snowpack, with dust layers D8/D7/D6 merged at or near the surface.
Aside from a small rebound in SWE in mid-May, and despite disruptions to maximum potential radiative forcing caused by unsettled (cloudy) weather and other additional snowfalls, spring 2013 snowmelt at the Red Mountain Pass Snotel was much more rapid than in WY 2012 and recorded “snow all gone” (SAG) within 28 days after peak SWE, on May 24, nearly a month more quickly than the 57 days from peak SWE to SAG in WY 2012. Melt rates were also very high at the Lizard Head Pass Snotel in spring 2013, falling from peak SWE to SAG in just 35 days, 15 days more quickly than in spring 2012. SAG at the open, un-shaded Swamp Angel Study Plot was on May 18, six days sooner than at the partially shaded Red Mountain Pass Snotel site despite a higher SWE total at SASP.
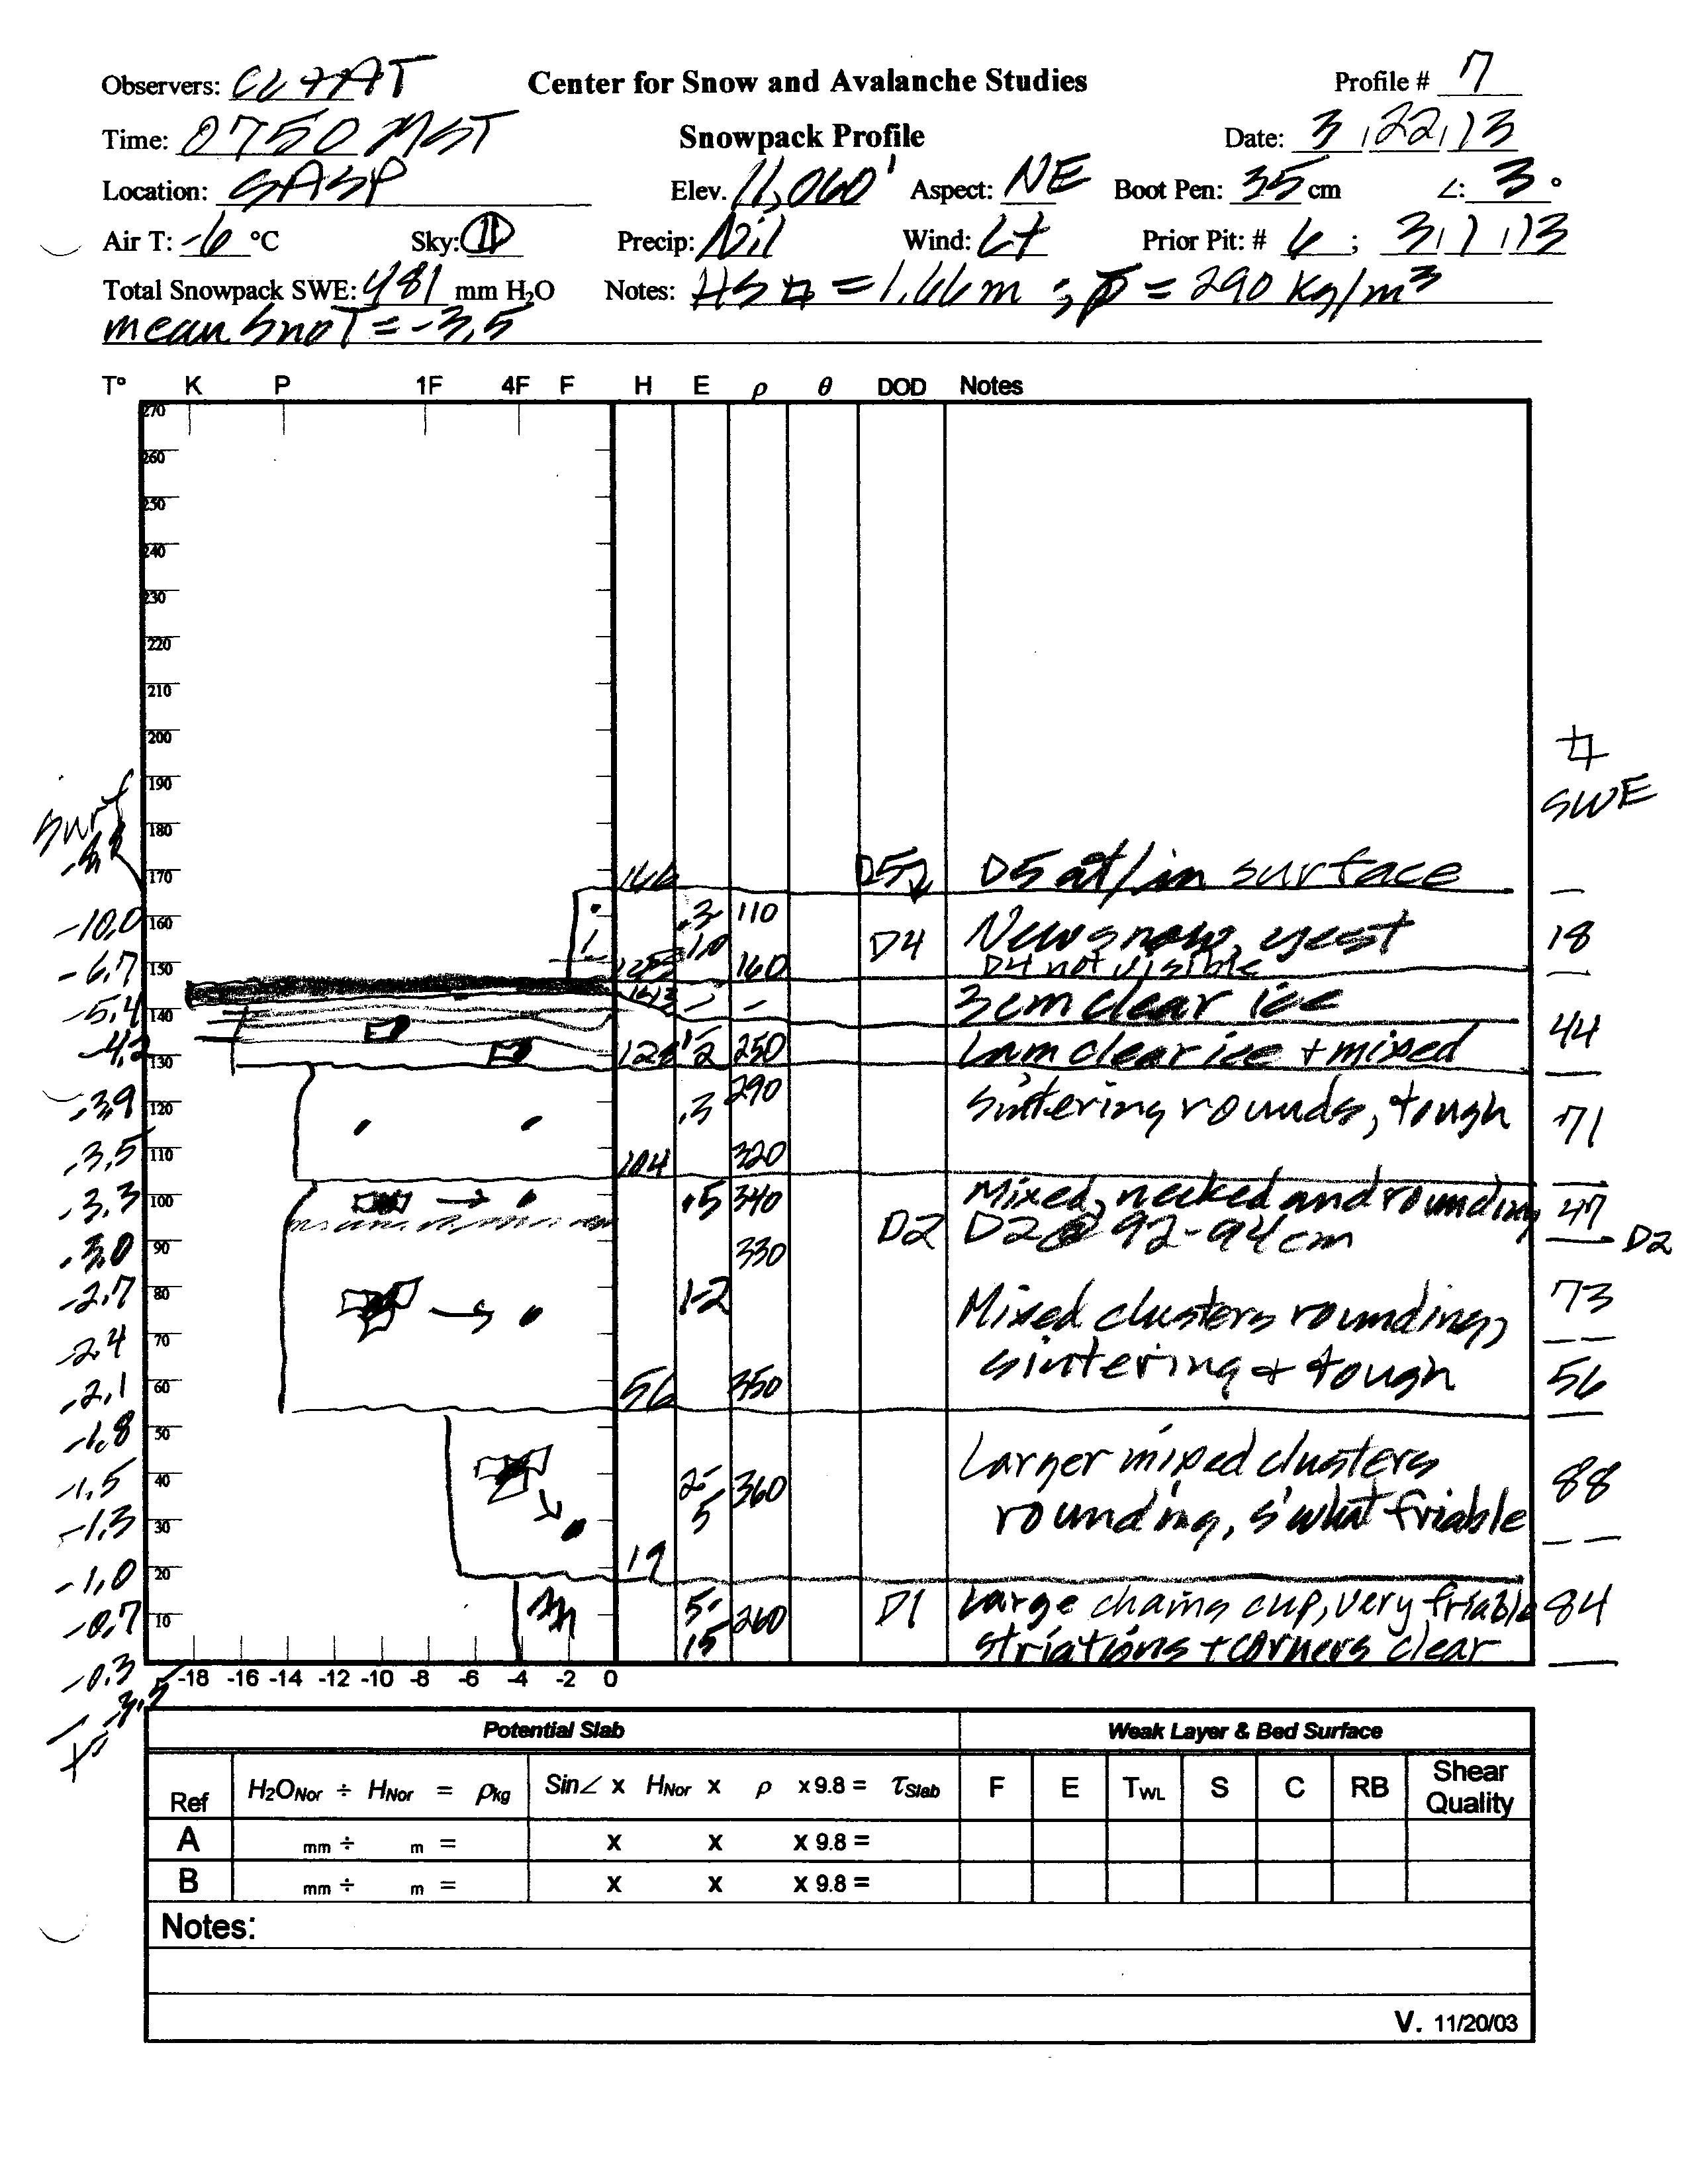
Snow profile #7 at the Swamp Angel Study Plot. Dust layer D5 is in the snowpack surface and layers D4, D2, and D1 were clearly visible in the snow pit wall.
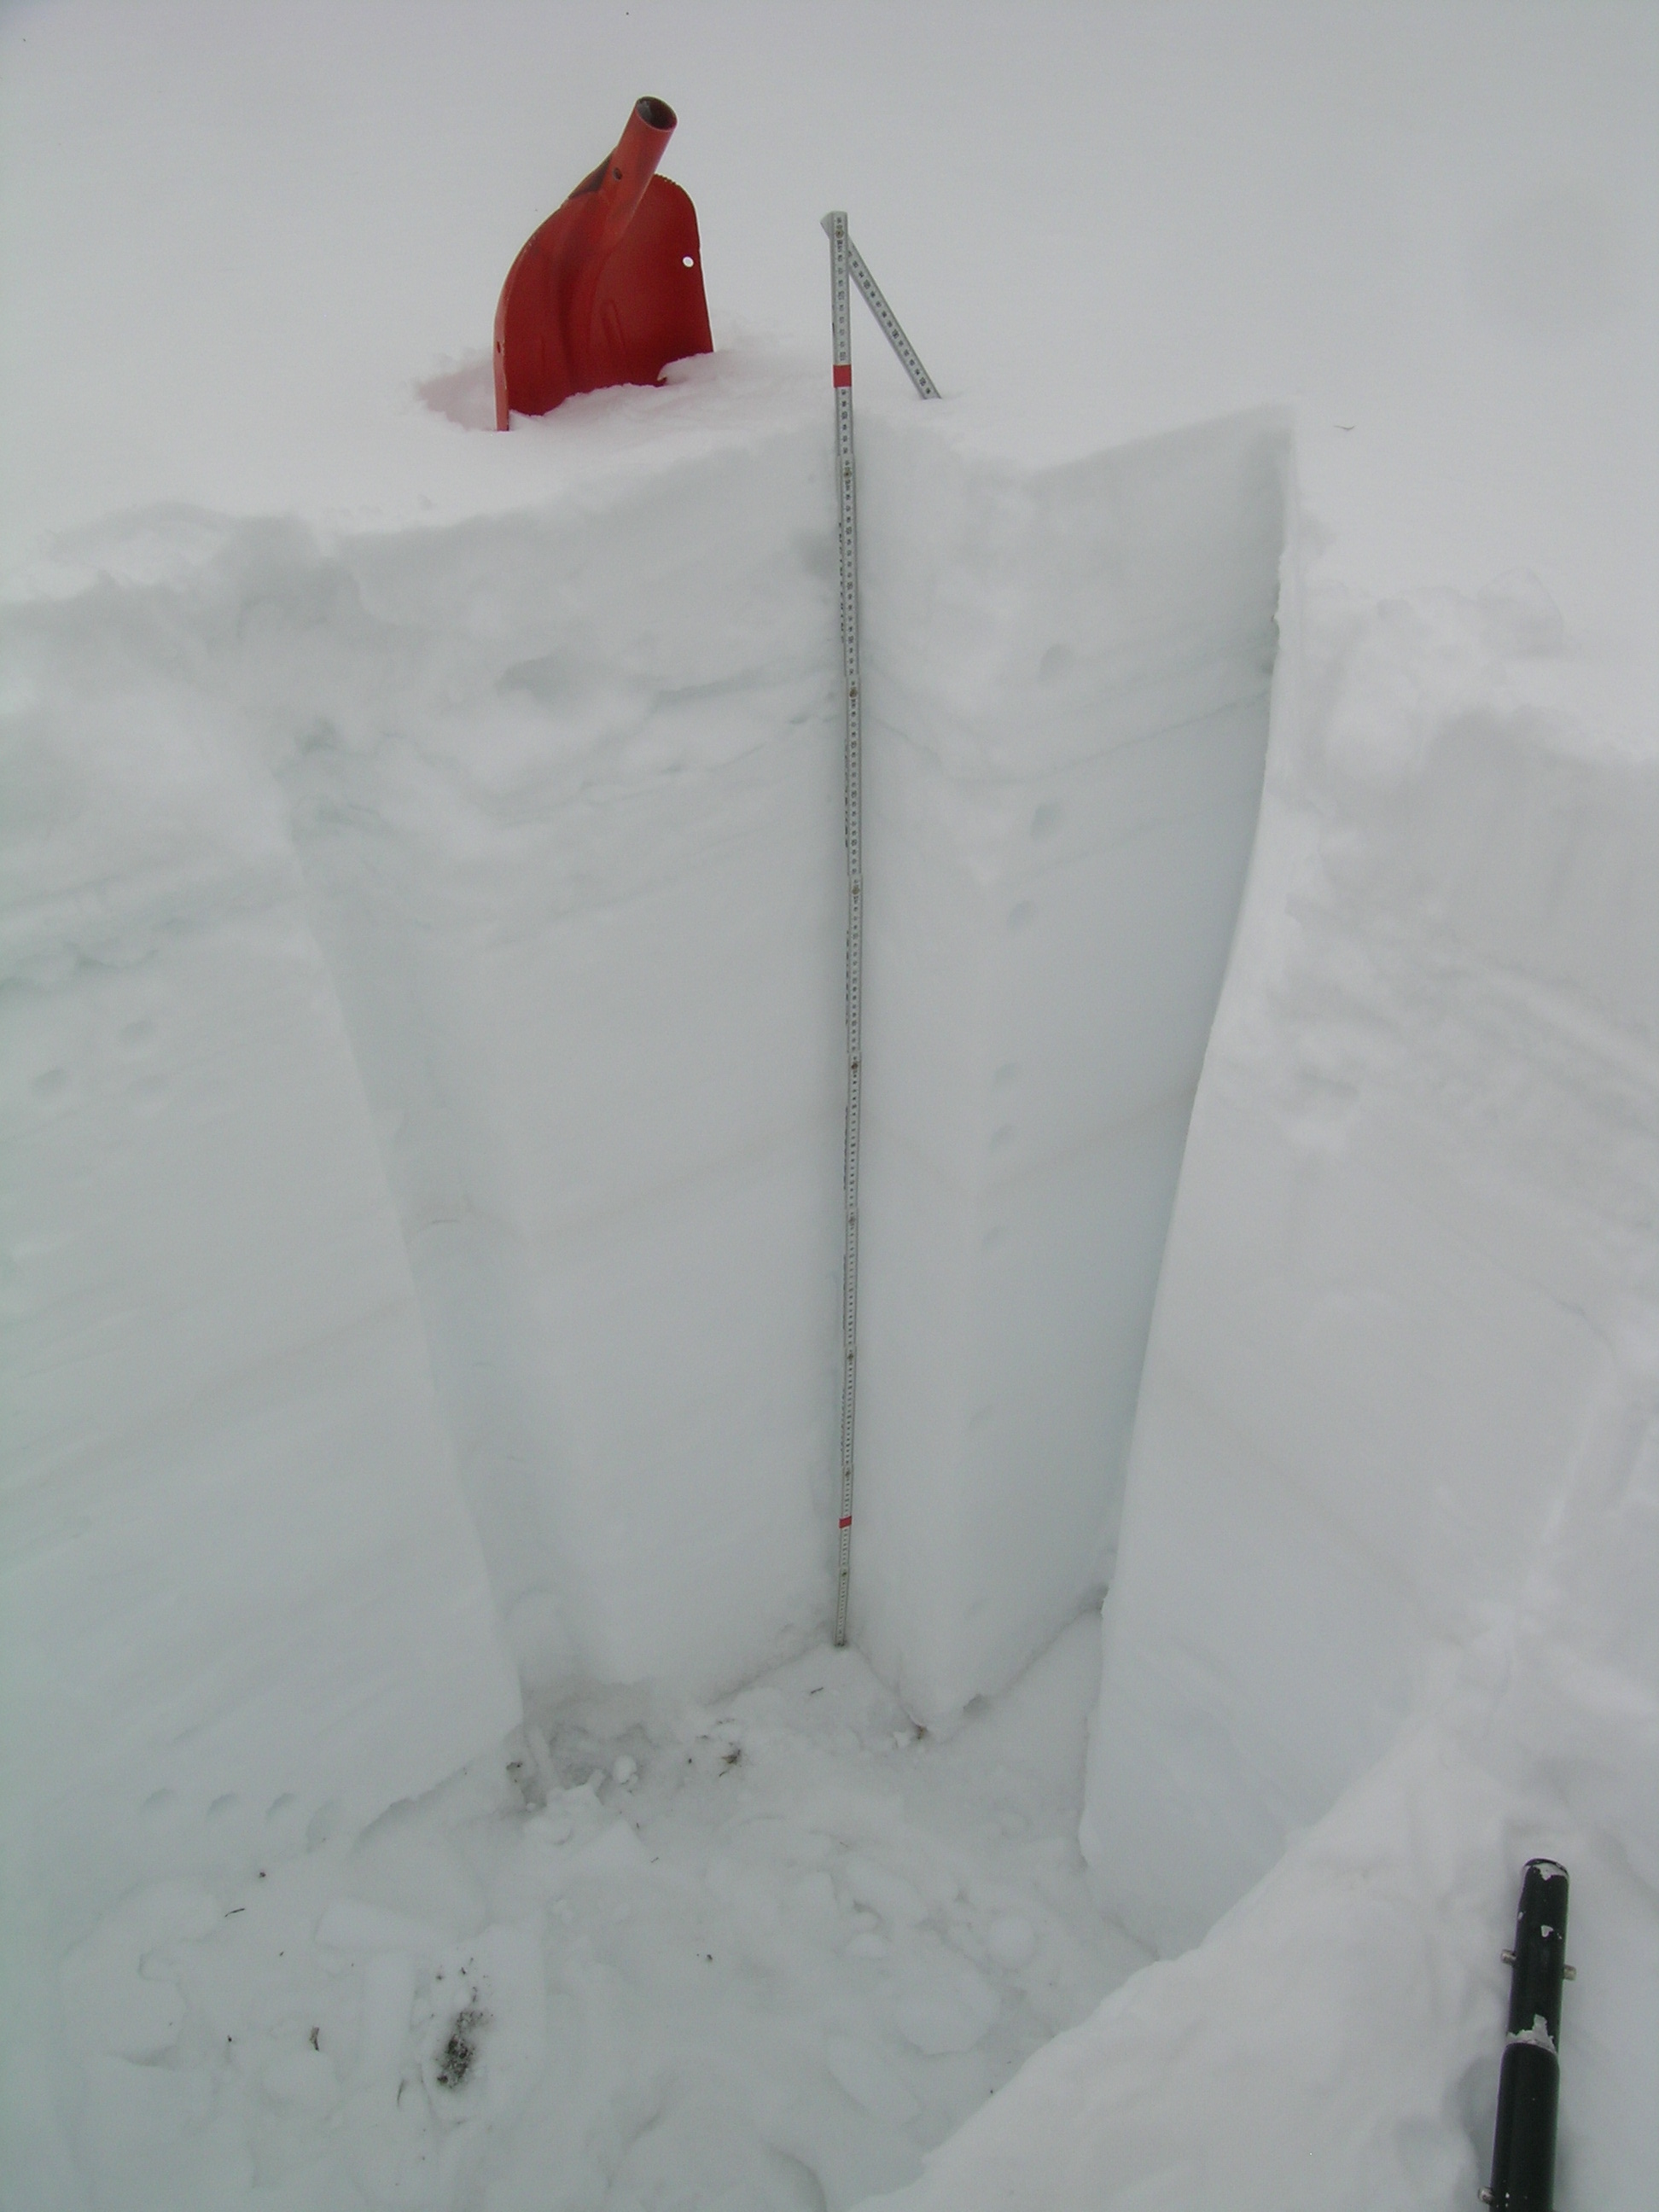
CSAS field assistant Andrew Temple preparing the snow pit for snow profile #11 at the Swamp Angel Study Plot, on April 16, 2013 with dust event
D8 in progress (and visible at the snowpack surface). Dust layer D6, of April 8th, is the very dark band some 6” below the snowpack surface.
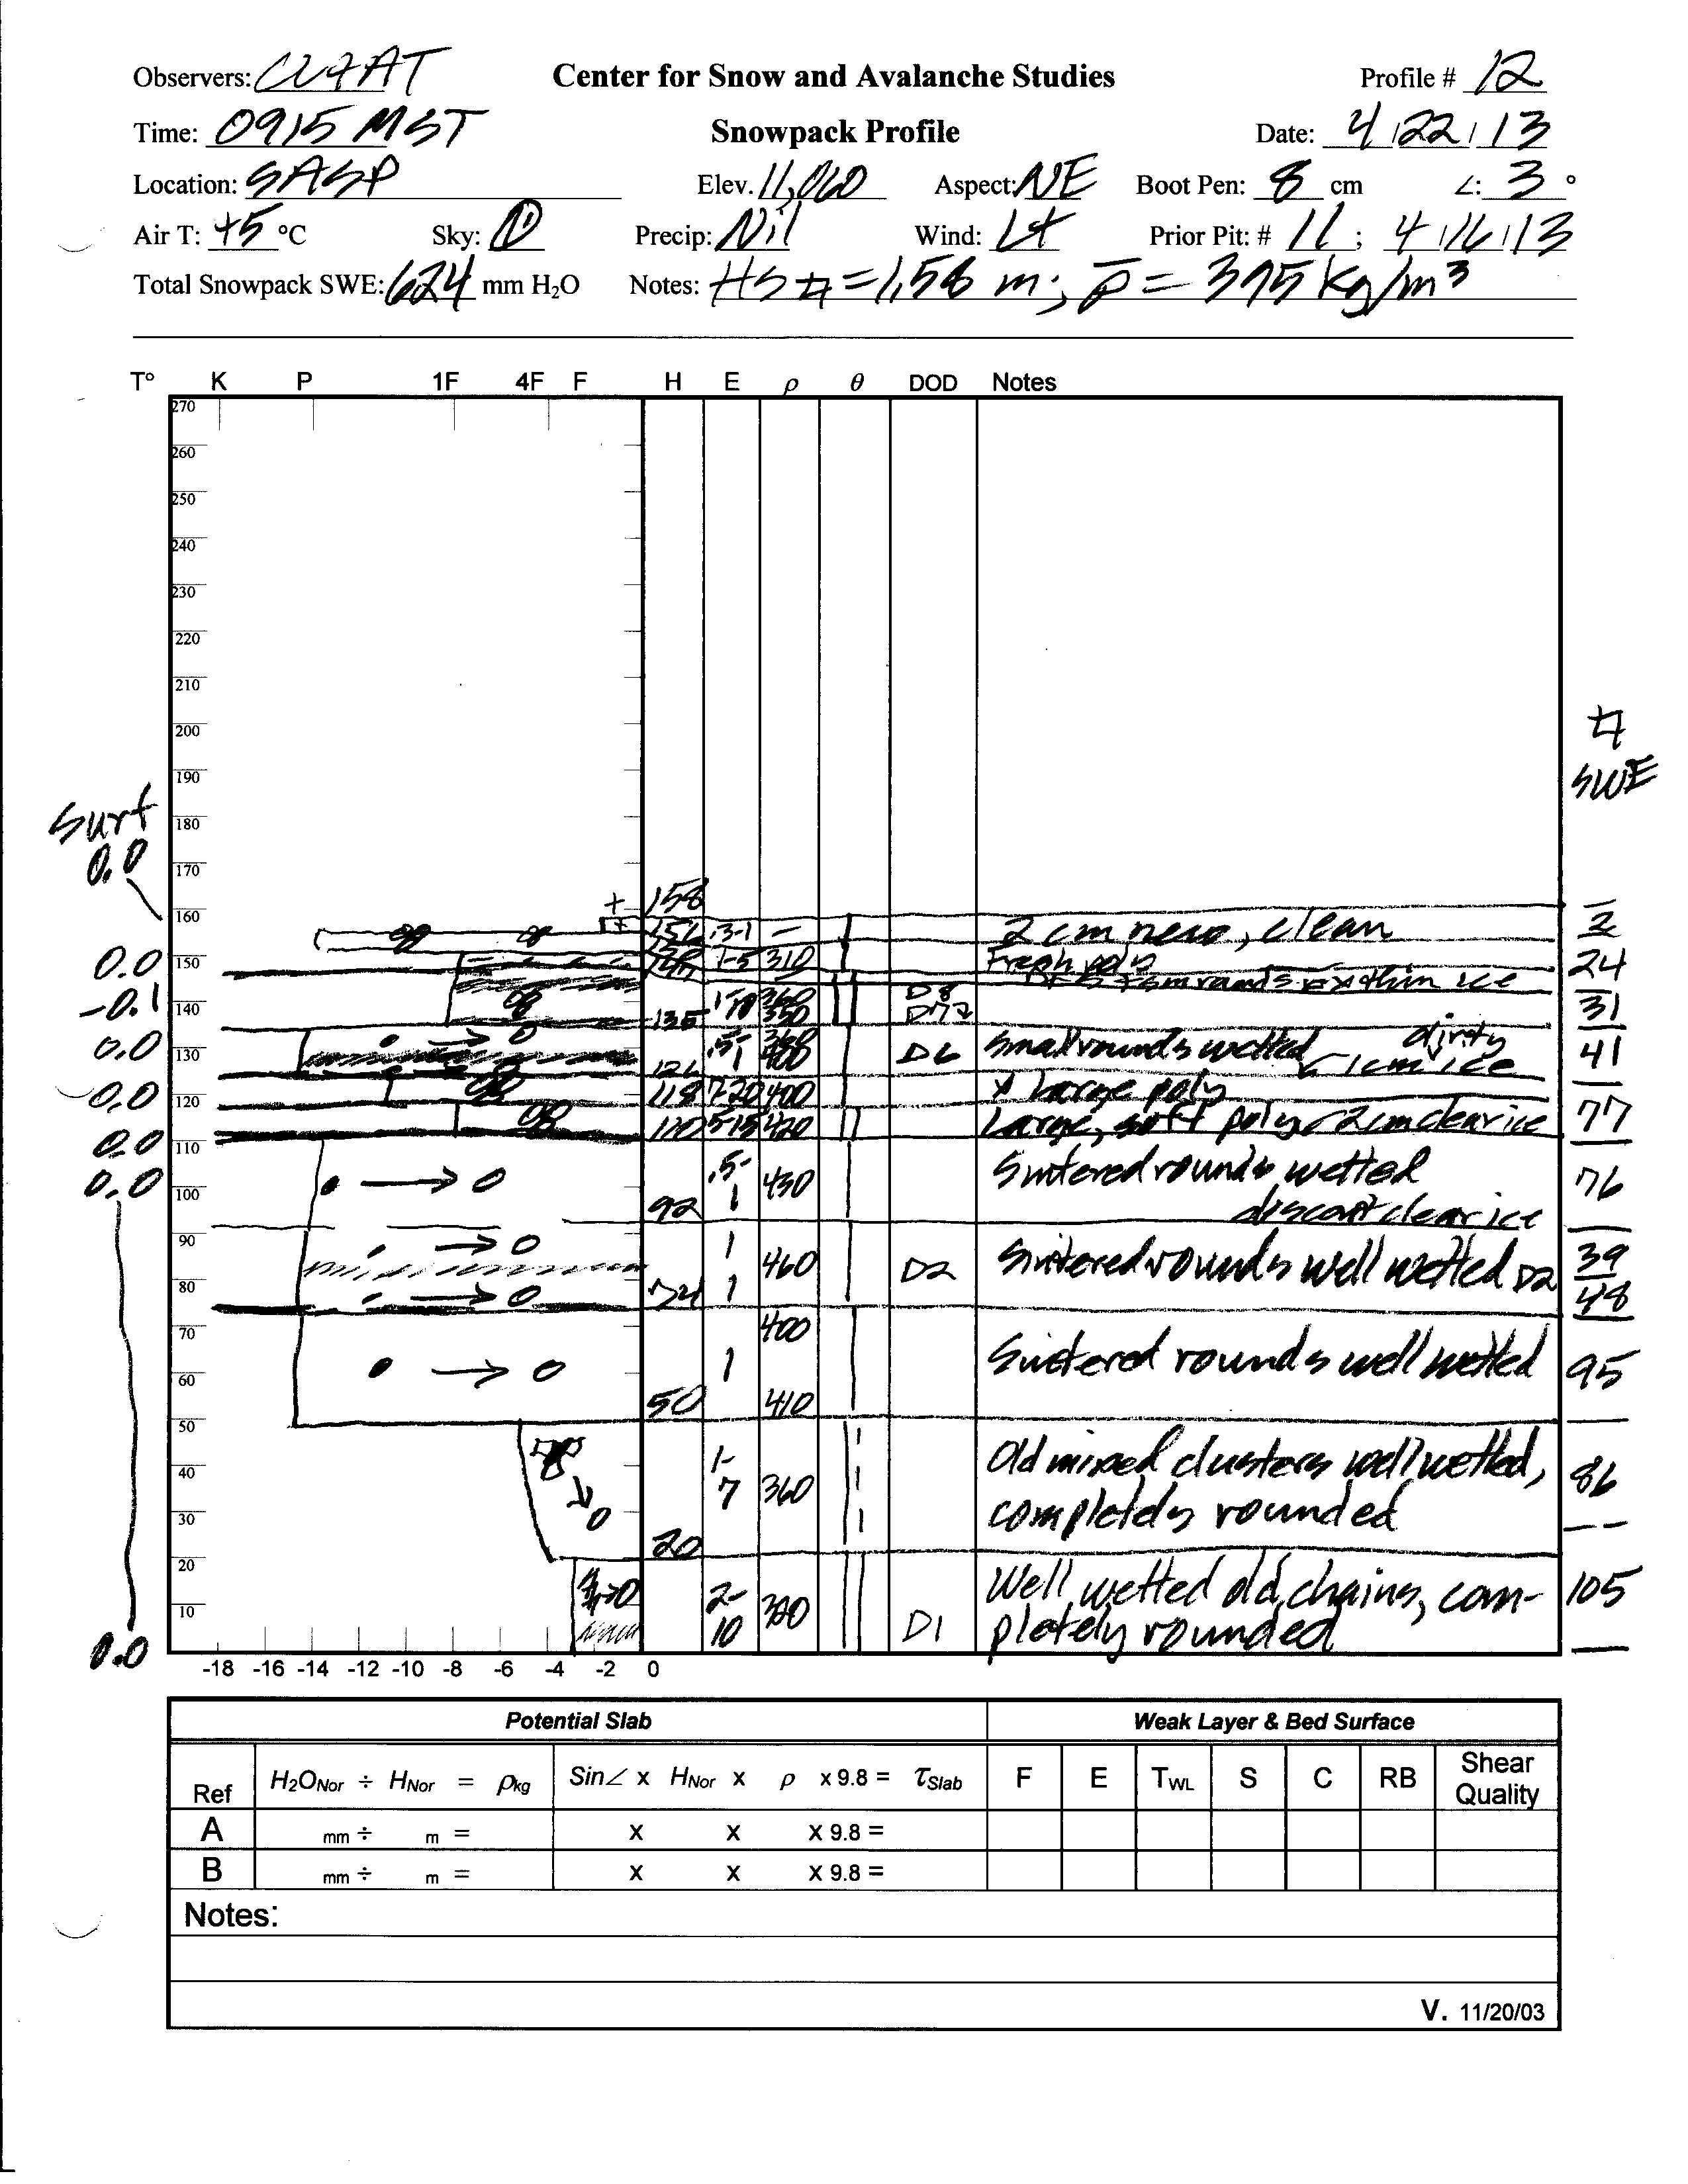

The isothermal April 22 snow profile #12 at Swamp Angel Study Plot shows the D6, D7, and D8 layers still separated by bands
of
comparatively cleaner snow and recent, clean new snow at the snowpack surface. Drier and sunnier weather would follow.
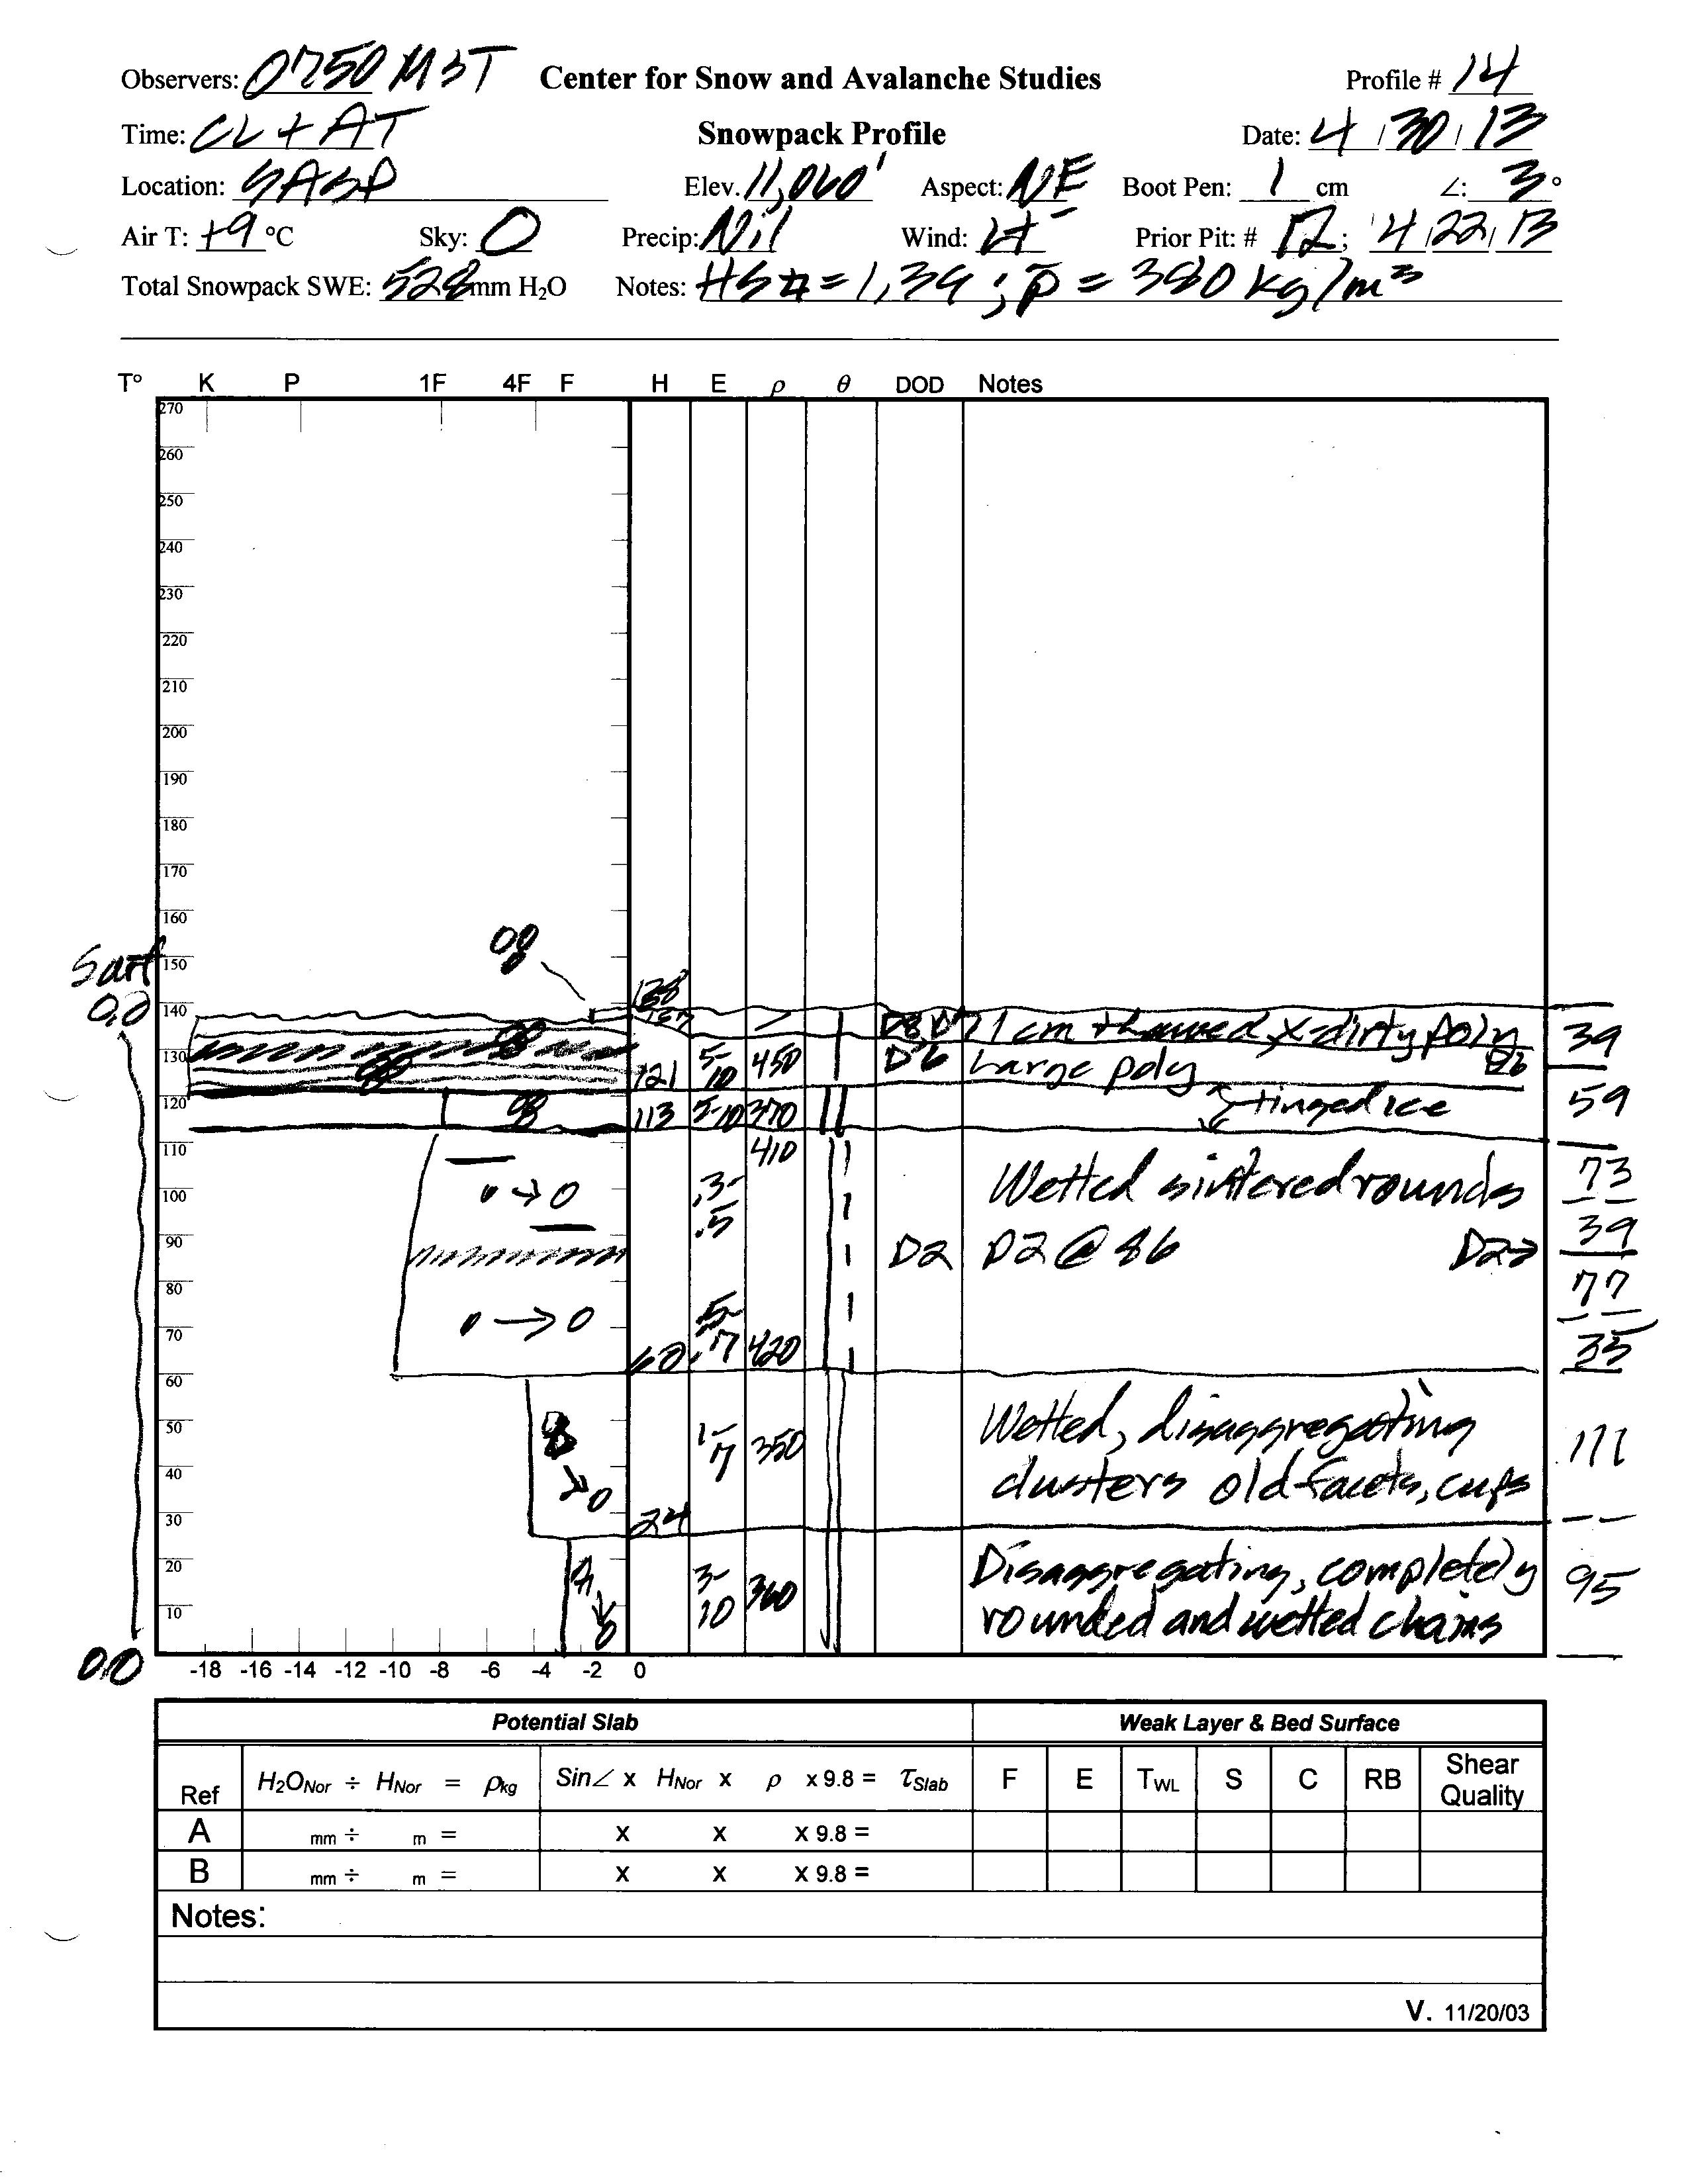
By April 30, snowmelt was well underway at Swamp Angel Study Plot and dust layers D8, D7, and D6 were merging in the snowpack surface.
SASP (left) on May 19, the day after the snow depth sensor recorded 0.0” snow depth. Snow melts around the instrument mast slightly sooner than on the remainder of the
study plot. And, SBSP (right) on May 27, just four days before that snow depth sensor recorded 0.0” snow depth. Snow melts from east to west under this instrument tower.
 |
 |
 |
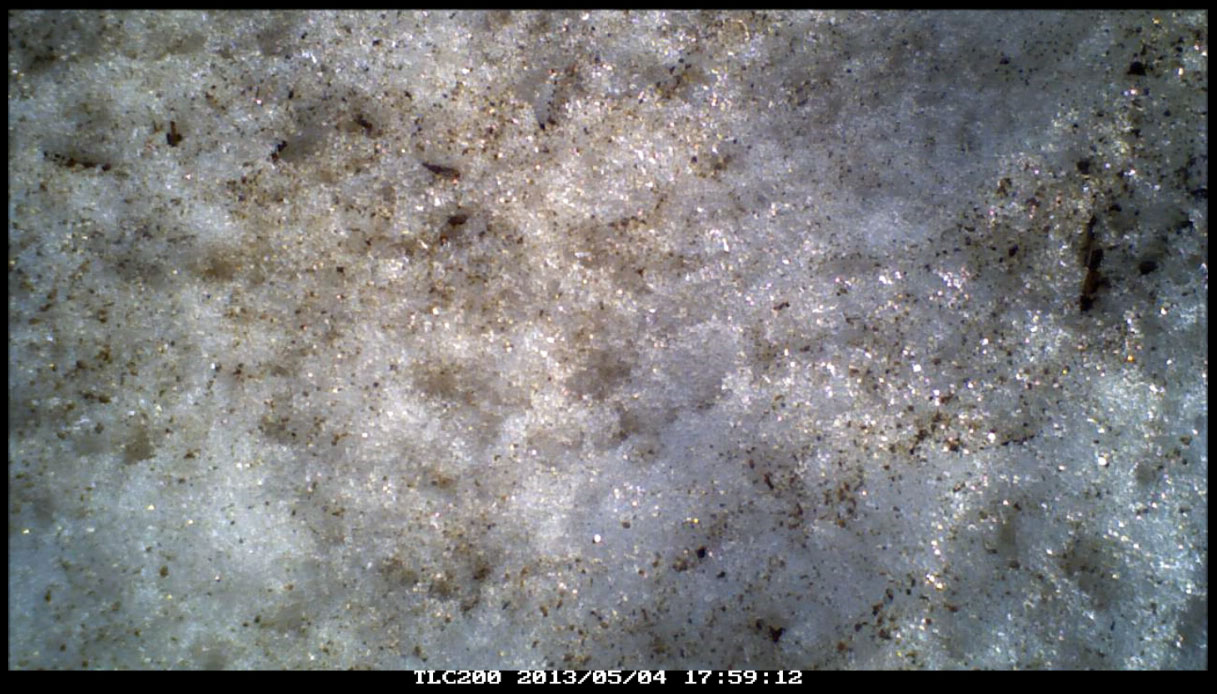
| Andrew Temple points out the gradations in dust color at the edge of a patch of clean snow on the shady side of a small gully on May 5, 2013. Andrew is standing on merged layers D8/D7/D6, with the extremely heavy and dark D6 layer dominating. He’s pointing to the fringe of redder, D8 dust just emerging from beneath the cleaner snow that fell over D8. Layer D7 was also distinguishable, as “iced tea” colored, at some locations. | Merged dust layers D8/D7/D6 were appearing underneath the Senator Beck Study Plot (SBSP) mast on May 5, visible to the downlooking radiometers. Such patches of dirty snow rapidly expand. Dust layers D8/D7/D6 are present, in significant concentration, underneath the comparatively clean patches of snow, where wind drifting added additional thickness to the snow layers separating those dust events. | Merged dust layers D8/D7/D6 were present in the snow surface at the snow profile plot at SBSP on May 5 and that snow was fully thawed and very wet at the time of the profile, despite increasing cloud cover. Dust layer D2 remains well buried at that site, in the middle of the snowpack. Examples of virtually all stages of dust emergence and snowpack ablation can be seen in the distance, on generally northeast-facing terrain. Bare ground is already exposed on terrain features that were likely wind stripped throughout the winter, never accumulating a thick snowcover and subject to earlier “snow all gone” under the effects of D8/D7/D6. |
 |
 |
| Andrew Temple looking southwest from Peak 13,510’ at the top of Senator Beck Basin on May 12, 2009, with all twelve WY 2009 dust layers merged and almost entirely emerged. | Andrew Temple looking southwest from Peak 13,510’ at the top of Senator Beck Basin on May 5, 2013, with dust layers D8, D7, and D6 in various stages of partial emergence and merger, but with a considerable fraction of cleaner areas where their emergence had not yet begun. |
Panorama photography further documents the degree of snow albedo reductions extant on May 5, even with incomplete dust emergence. As they say, a picture is worth 1,000 words, but no picture can capture the surreal impact of these scenes, in person. (Expand these to 100%, for maximum impact).

A panorama on May 5, 2013 from the Senator Beck Study Plot ranging from east, on the far left, to west, on the far right, showing much of the Red Mountain Pass locale. Trico Peak is seen above SBSP. Peak 13,510’, at the top of Senator Beck Basin, is just out of view on the far right. Dust layers D8/D7/D6 are seen in varying degrees of emergence and merger throughout the terrain.
The above panorama on May 5, 2013 from Peak 13,510’ looks from southwest, at the far left, to northwest, at the far right. Ingram Basin is directly beneath Peak 13,510’, immediately above Telluride. Mount Sneffels (14,150’) is the high point to the right of Telluride.
Melt Rate
Analyses of Red Mountain Pass and Lizard Head Pass Snotel data for Water Years 2006-2013 snowmelt seasons showing date and quantity of peak SWE, days from peak SWE to “snow all gone” (SAG), total additional precipitation after the date of peak SWE, an “adjusted” mean daily rate of snowmelt adding the additional precipitation to the peak SWE total, the maximum five-day moving average of daily melt, and the mean air temperature over the entire snowmelt period, from peak SWE to SAG.
As was the case throughout the Colorado mountains, dust layers D8 and D6 were the dominant dust-in-snow features in Senator Beck Basin, at the headwaters of the Uncompahgre River, and in adjoining Animas River, Dolores River, and San Miguel River headwaters. Even though those dust layers were deposited high in the snow column, and were quick to emerge following peak SWE, periods of unsettled often reduced the potential maximum radiative forcing effects of the merged D8/D7/D6 (and lower) dust layers, prolonging the snowmelt cycle. Frequent periods of cloud cover often reduced solar insolation onto the exposed D8/D6 layer and/or minor amounts of fresh snow temporarily restored a higher albedo to the remaining snowpack and incrementally slowed melt rates.
WY 2013 SWE accumulation and ablation at the Red Mountain Pass and Lizard Head Pass Snotel stations, with upper and lower quartiles of period of record shown in light grey, middle quartiles in dark grey, and the median trace for the period of record shown as a dashed line.
The Red Mountain Pass Snotel is located in the Animas River headwaters 1 mile south of the Swamp Angel Study Plot, at a very similar elevation. Peak SWE at the Red Mountain Pass Snotel of 19.6” occurred on April 26. After April 26, an additional 0.8” of SWE was added to the snowpack during the ablation cycle for an adjusted total of 20.4” of SWE available to melt. Over the 28 days from peak SWE 2013 to SAG, virtually the same amount of available SWE was melted (to SAG) in 29 fewer days than in spring 2012, under somewhat slightly warmer mean air temperatures. That more rapid snowmelt was driven by the intensity of radiative forcing produced by merged dust layers D8/D6. Melt rates were as high as 1.6” SWE loss per day, the mean daily SWE loss was 0.73” per day, and the maximum 5-day moving average daily melt rate of 1.24” loss per day was substantially higher than the 0.86” loss per day observed in WY 2012. In the end, WY 2013 SAG on May 24 at Red Mountain Pass occurred nearly three weeks ahead of the median date of SAG.
In Senator Beck Basin, our weekly manual measurements of SWE at Swamp Angel Study Plot established peak SWE at 24.6”, in profile #12, on April 22. An additional 1.2” of snow fell following the April 22 peak for a total of 25.8” of SWE available to melt. Swamp Angel Study Plot SAG was on May 18, yielding a mean melt rate of 0.99” SWE loss per day. Again, SASP is an open site with full solar exposure whereas the Red Mountain Pass Snotel site is substantially shaded by trees to the east, south, and west.
Nearby, in the Dolores River headwaters, at the Lizard Head Pass Snotel located 14 miles southwest of the Red Mountain Pass Snotel, and 1,000 feet lower in elevation, peak SWE of 11.2” occurred on March 25, a full month earlier than at Red Mountain Pass. After March 25, only an additional 0.6” of SWE was added to the snowpack during the ablation cycle for an adjusted total of 20.4” of SWE available to melt. Most of the storms adding SWE to the Red Mountain Pass and Senator Beck Basin snowpacks in late March and April simply did not ‘produce’ at the Lizard Head Pass locale, but all of the dust events of April and May clearly did fall at that site.
Over the 35 days from peak SWE 2013 to SAG at the Lizard Head Pass Snotel, some 2.2” less available SWE was melted in 15 fewer days than in spring 2012, under slightly cooler mean air temperatures. That more rapid snowmelt was driven by the intensity of radiative forcing produced by merged dust layers D8/D6. Melt rates were as high as 1.6” SWE loss per day, the mean daily SWE loss was 0.73” per day, and the maximum 5-day moving average daily melt rate of 1.24” loss per day was substantially higher than the 0.86” loss per day observed in WY 2012. In the end, WY 2013 SAG on May 24 at Red Mountain Pass occurred nearly three weeks ahead of the median date of SAG.
Stream Flows
As of this writing, WY 2013 snowmelt runoff discharge at the Senator Beck Stream Gauge has begun the descending limb of the hydrograph, as snowpack ablation is proceeding in the lingering alpine snowcover at Senator Beck Basin. Snowmelt runoff began in earnest with a strong surge in late April, as dust layers D8, D7, and D6 emerged and merged. Following a partial retreat in flows in early May, a second very strong and sustained surge followed, with accelerations in runoff matching the steep rates of 2009. That surge was also curtailed by unsettled weather. The highest 24-hour average discharge of 13.47 cfs occurred at the peak of the second surge, on May 17. A third surge followed, rising quickly to the season's single-hour peak flow of 19.2 cfs, from 2000-2100 hours on May 24. Following yet another spring snowfall, descending limb flows resumed.
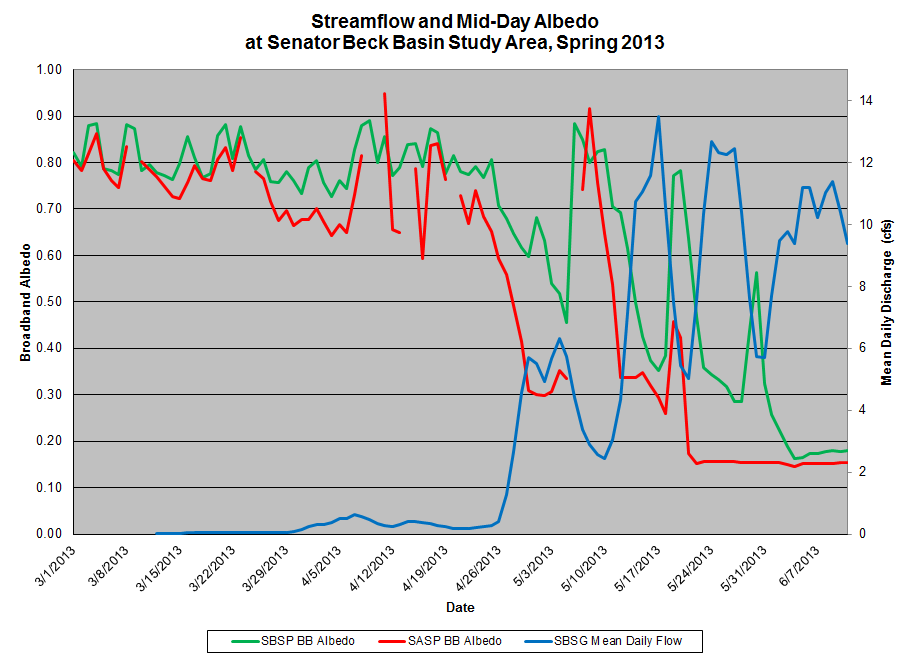
This graph presents mid-day snow albedo data from the alpine Senator Beck Study Plot and the subalpine Swamp Angel Study Plot, from March 1, 2013 to the date of this writing, in conjunction with daily mean discharge measurements at the Senator Beck Stream Gauge, located at the Senator Beck Basin pour point immediately downstream of the Swamp Angel Study Plot. Gaps in the SASP represent periods when the up-looking radiometer was buried in new snow, before being swept clean immediately after a storm. Albedo values below 0.20 indicate "snow all gone" and represent the albedo of bare soil and tundra.
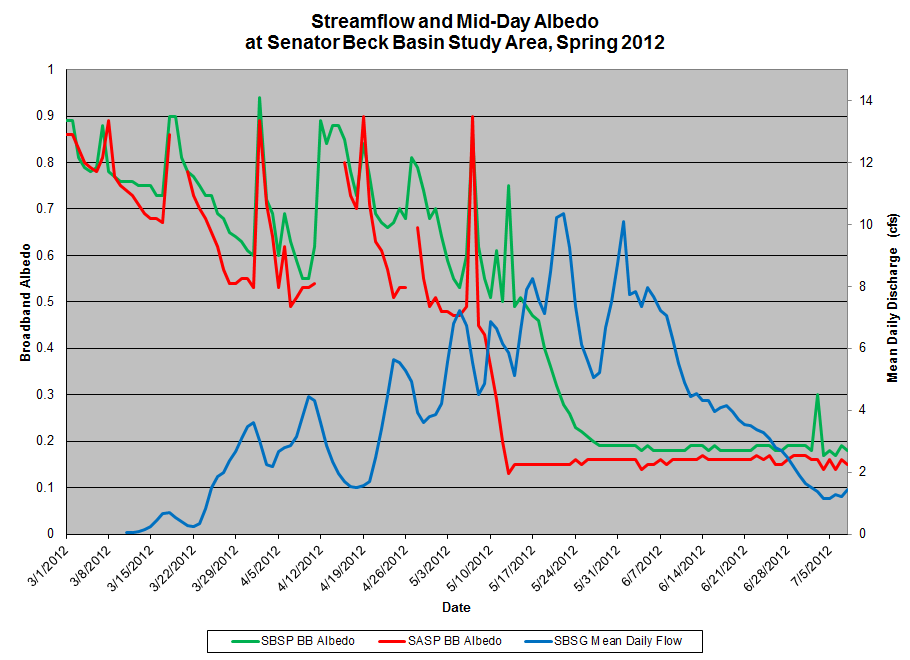
This graph presents mid-day snow albedo data from the alpine Senator Beck Study Plot and the subalpine Swamp Angel Study Plot, from March 1, 2012 to July 8, 2012 in conjunction with daily mean discharge measurements at the Senator Beck Stream Gauge, located at the Senator Beck Basin pour point immediately downstream of the Swamp Angel Study Plot. Gaps in the SASP represent periods when the up-looking radiometer was buried in new snow, before being swept clean immediately after a storm. Albedo values below 0.20 indicate "snow all gone" and represent the albedo of bare soil and tundra. The spike in albedo at SBSP on July 4th mostly likely represents hail.
Graphs of the daily mean WY 2013 and WY 2012 snowmelt runoff behaviors at Senator Beck Basin depict a clear inverse relationship with snow albedo measurements at our 11,060’ Swamp Angel Study Plot (SASP) and the 12,180’ Senator Beck Study Plot (SBSP) sites. As albedo values declined, snowmelt runoff increased; as higher albedo was restored by clean new snowfalls, stream flows declined until dust re-emerged and albedos declined again. Low-end SASP albedo values are routinely lower than those at SBSP, when dust is exposed at both sites. Dust deposition is often more uniform in the snowpack surface at the well-sheltered SASP than at the exposed SBSP, due to wind effects on dust deposition at SBSP. Nonetheless, both sites measured very low albedo values during spring 2013.
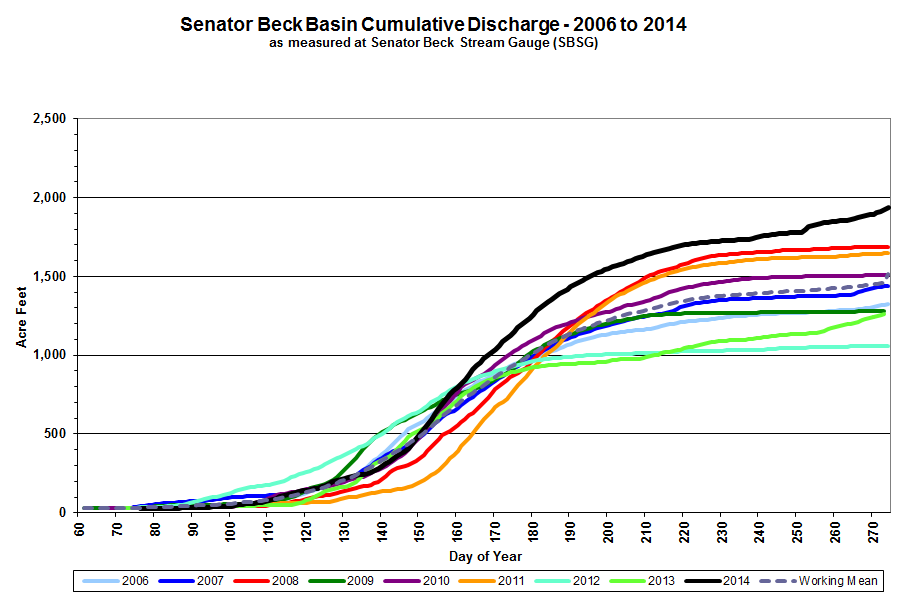
Cumulative discharge at the Senator Beck Stream Gauge (SBSG) for spring, summer and fall 2006-2013, with a “working mean” shown.
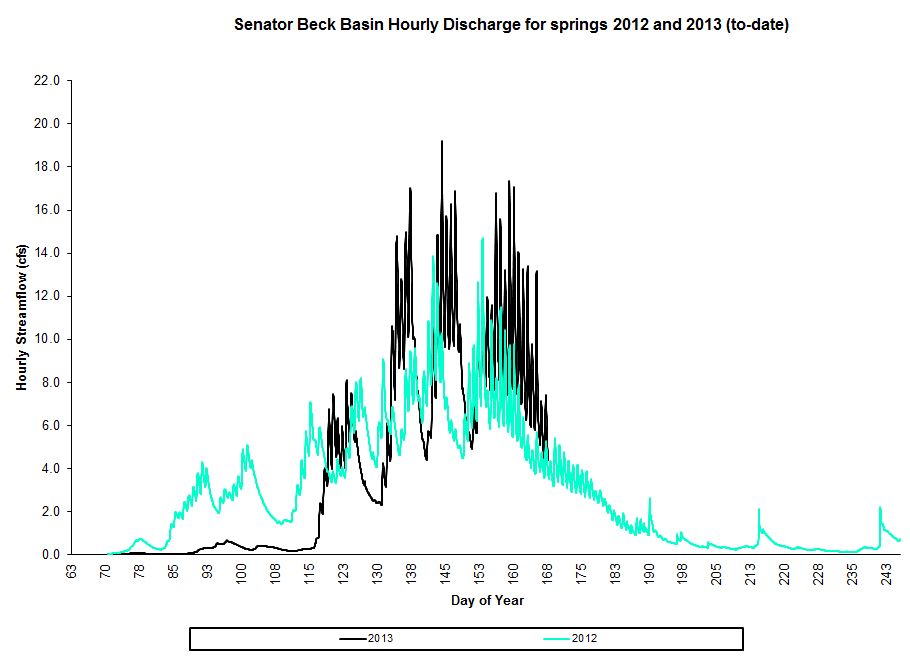
Hourly discharge at the Senator Beck Stream Gauge (SBSG) for springs 2012 and 2013 (current season in progress).
Overall, given that WY2013 peak SWE at Swamp Angel Study Plot was 3.2” higher than in WY2012, a greater cumulative snowmelt runoff yield might be expected this season and the current plot appears to be on that trajectory. As of this writing, the rate of decline in Senator Beck Basin discharge appears normal, but the intense radiative forcing of snowmelt produced by merged dust layers on the remaining snowcover may eventually result in a comparatively steep descending limb. In conjunction with the late start to runoff, WY 2013 may produce a compressed, “flashy” hydrograph at the Senator Beck Stream Gauge.
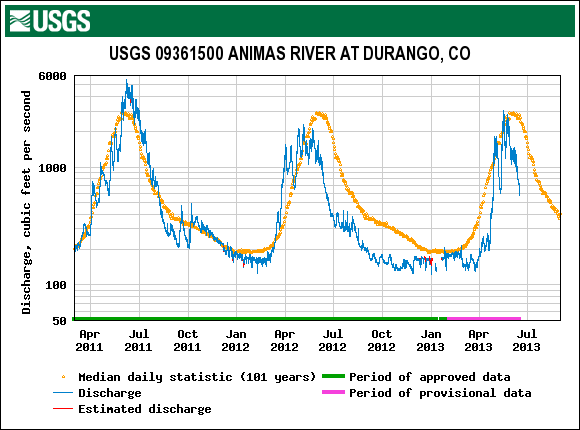
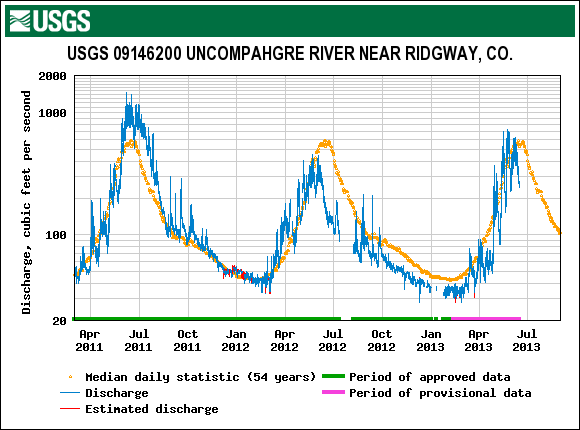

Comparison of WY 2011, 2012 and 2013 (in progress) hydrographs from four western San Juan Mountain watersheds highlight year-to-year variations in snowmelt runoff timing and volumes at those gauges as well as similarities among gauges during a given year.
In all four major western San Juan Mountain watersheds - the Animas, Dolores, San Miguel, and Uncompahgre Rivers - WY 2011 snowmelt runoff generally tracked the median ascending limb at their respective gauges (the Dolores lagging the most), oscillating several times as substantial dust-in-snow was alternately exposed and reburied under relentless spring storms. Eventually, flows surged sharply to substantially above-average peaks near the average dates of peak discharge (the Dolores again being a little later), as dust finally emerged and remained exposed. Flows then descended at a near normal rate but remained above median levels for much of the remainder of the snowmelt runoff cycle (the Dolores again being quicker to fall to median levels).
In contrast, with very dry March weather and dust at the snowpack surface, WY 2012 snowmelt runoff in the western San Juan Mountains generally began earlier than in 2011 and produced rapid surges at all four gauges in late March to unusually high discharge levels by April 1. Several oscillations in flows followed but all four gauges recorded their peak flow well in advance of median timing and below median levels (the Dolores perhaps coming closest to a median peak). Very steep descending limbs followed and discharges fell substantially below median levels for the duration of the snowmelt season. WY 2012 total snowmelt runoff yields at all four gauges were very far short of average yields.
This season, onset WY 2013 snowmelt runoff was as much as a month later than in WY 2012 thanks to unsettled March and early April weather, versus the extremely dry and sunny March of 2012. Overall, despite the frequent interruptions to radiative forcing in dust layers D8/D6 described earlier, and the resulting erratically surging flows often lagging behind median levels, the WY 2013 ascending limbs show an overall steeper rate of increase to a somewhat higher peak than in WY 2012 (Dolores peak flows were most similar over the two years).
As of this writing (June 17, 2013), all four gauges have peaked and begun their descending limbs, with the two ‘southern’ watersheds – the Animas and Dolores – farther along in their decline than the more northwesterly San Miguel and northerly Uncompahgre watersheds. After this runoff cycle has concluded, it appears likely that the intense effects of dust layers D6 and D8 on snowmelt runoff in the western San Juan Mountains, once that runoff got underway, resulted in “flashier” WY 2013 hydrographs displaying earlier timing of higher peak flows than in WY 2012, steeper ascending and descending limbs than in WY 2012, and similarly poor net runoff volumes.New and Ongoing Research
USGS Collaboration
The Center for Snow and Avalanche Studies (CSAS), through the CODOS program, continues to collaborate with the USGS Geosciences and Environmental Change Science Center and their “Effects of Climatic Variability and Land Use on American Drylands” project team in Denver. Those who attended the mid-winter Colorado Water Congress may recall an excellent presentation by Rich Reynolds about their research activities in Colorado Plateau and other Utah dust source areas. That talk described their own field work in those source areas as well as ongoing analyses of dust samples collected by CODOS at Senator Beck Basin, seeking to more rigorously identify source areas for that dust-on-snow as well as to better understand the physical properties of that dust, particularly its radiative properties. CODOS continued to collect those Senator Beck Basin “concentrated” samples for USGS this season, sending them discrete samples of events D1-D8; events D9 and D10 were very weak dust-on-dust events and sampling was infeasible.
A concentrated sample of merged dust layers collected at Hoosier Pass on May 22, 2013 for analyses by USGS.
In addition to those eight single-event Senator Beck Basin concentrated samples, another set of concentrated dust samples was collected near the end of the season that contained most or all of the dust layers merged at the snowpack surface at Senator Beck Basin and at all ten of our other CODOS monitoring sites. Those eleven ‘all layers merged’ dust samples will also undergo chemical and other analyses that will identify similarities and/or differences in dust composition among the CODOS sites. All of these analyses of WY 2013 concentrated dust samples are ongoing as of this writing.
Finally, in addition to these concentrated, single-event samples, where we collect as much dust-in-snow as we can carry out of Senator Beck Basin, we also collect a 0.5 m2 “mass loading” sample of each dust event, as feasible, and send that sample to USGS. USGS processes those samples for CODOS, carefully evaporating the water and then drying and weighing the dust. USGS began processing those samples for CODOS in WY 2011 and WY 2013 data are presented above.
Dust-Induced Snow Surface Roughness
Our May 6, 2013 CODOS Update discussed our observations, over several years, of dust-induced snowpack surface conditions that are not otherwise observed in clean spring snow. Between April 30 and May 18, 2013 we captured time lapse imagery at 1 minute intervals of a rapidly changing snow surface in a small meadow adjacent to the Swamp Angel Study Plot. The compiled ‘video’ shows the formation and collapse of dust-induced snow ‘fins’, followed by new snow accumulation, and later, full melt to the ground revealing the Senator Beck Basin stream. A second series of images shot from the same location over the same period of time, also at 1-minute intervals, shows surface snowmelt behavior close up. At a presentation speed of 30 images per second, dust particles, pine needles, and even individual snow grains appear remarkably active and mobile in that video.
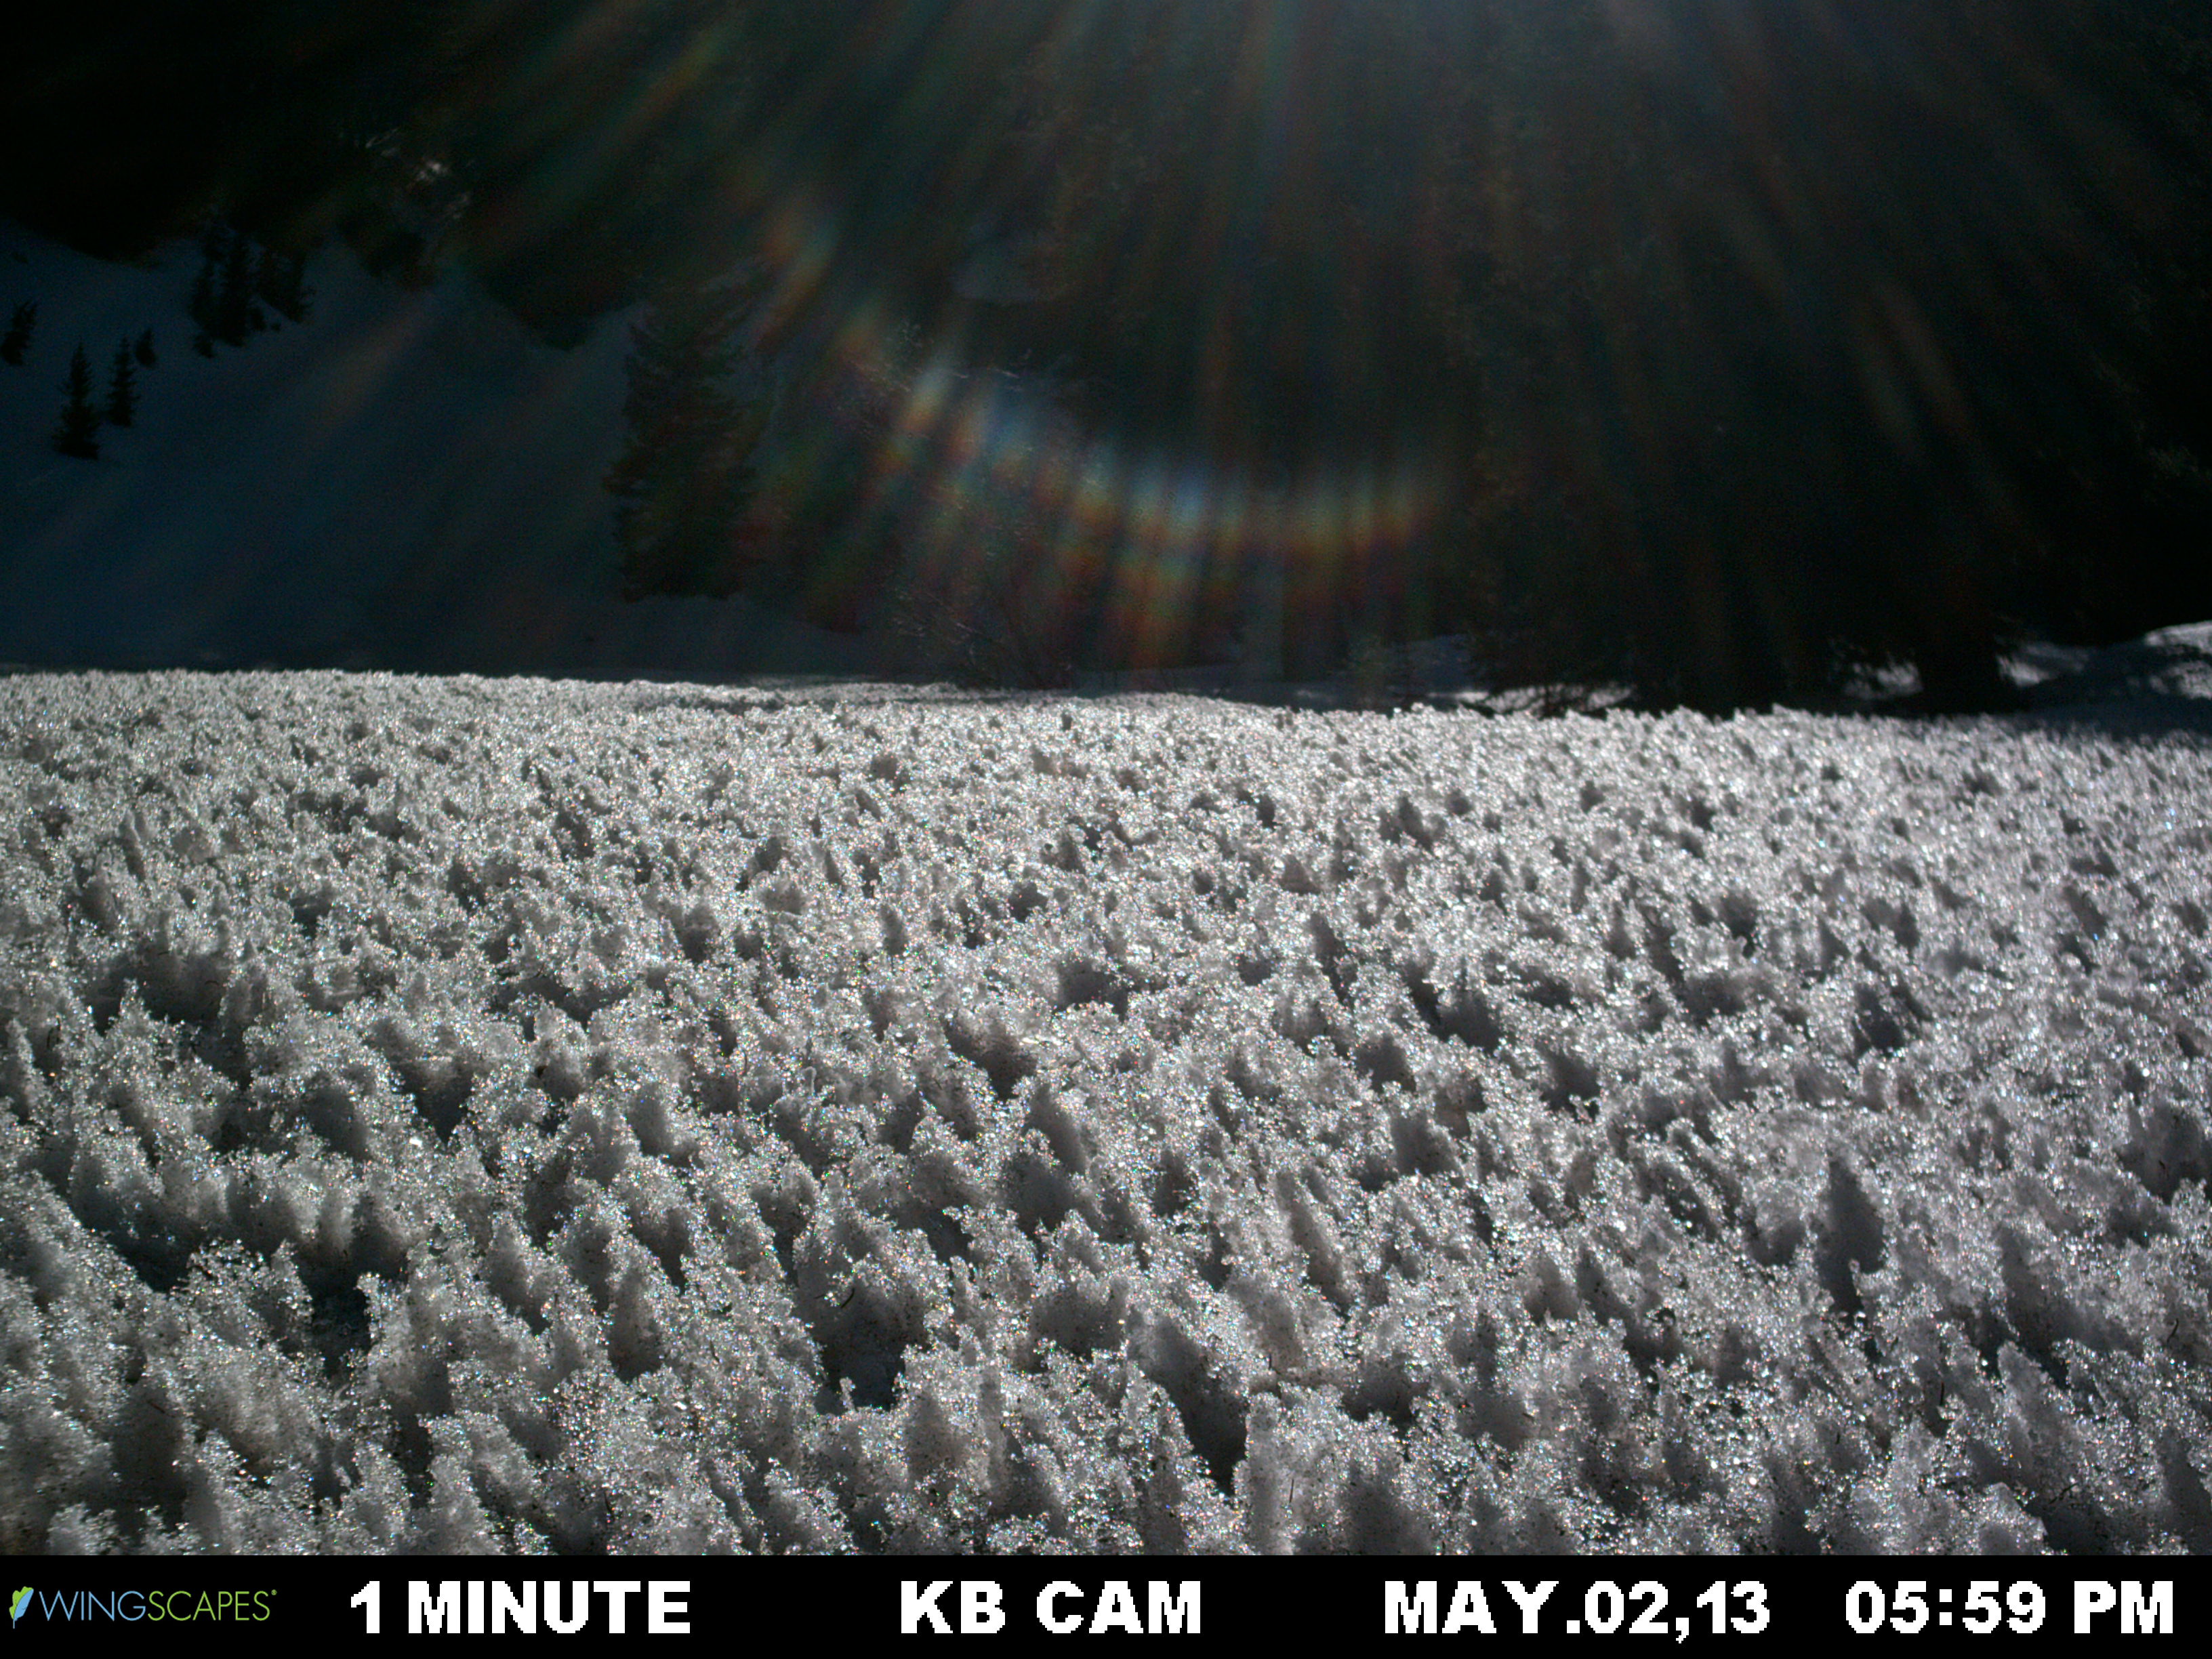
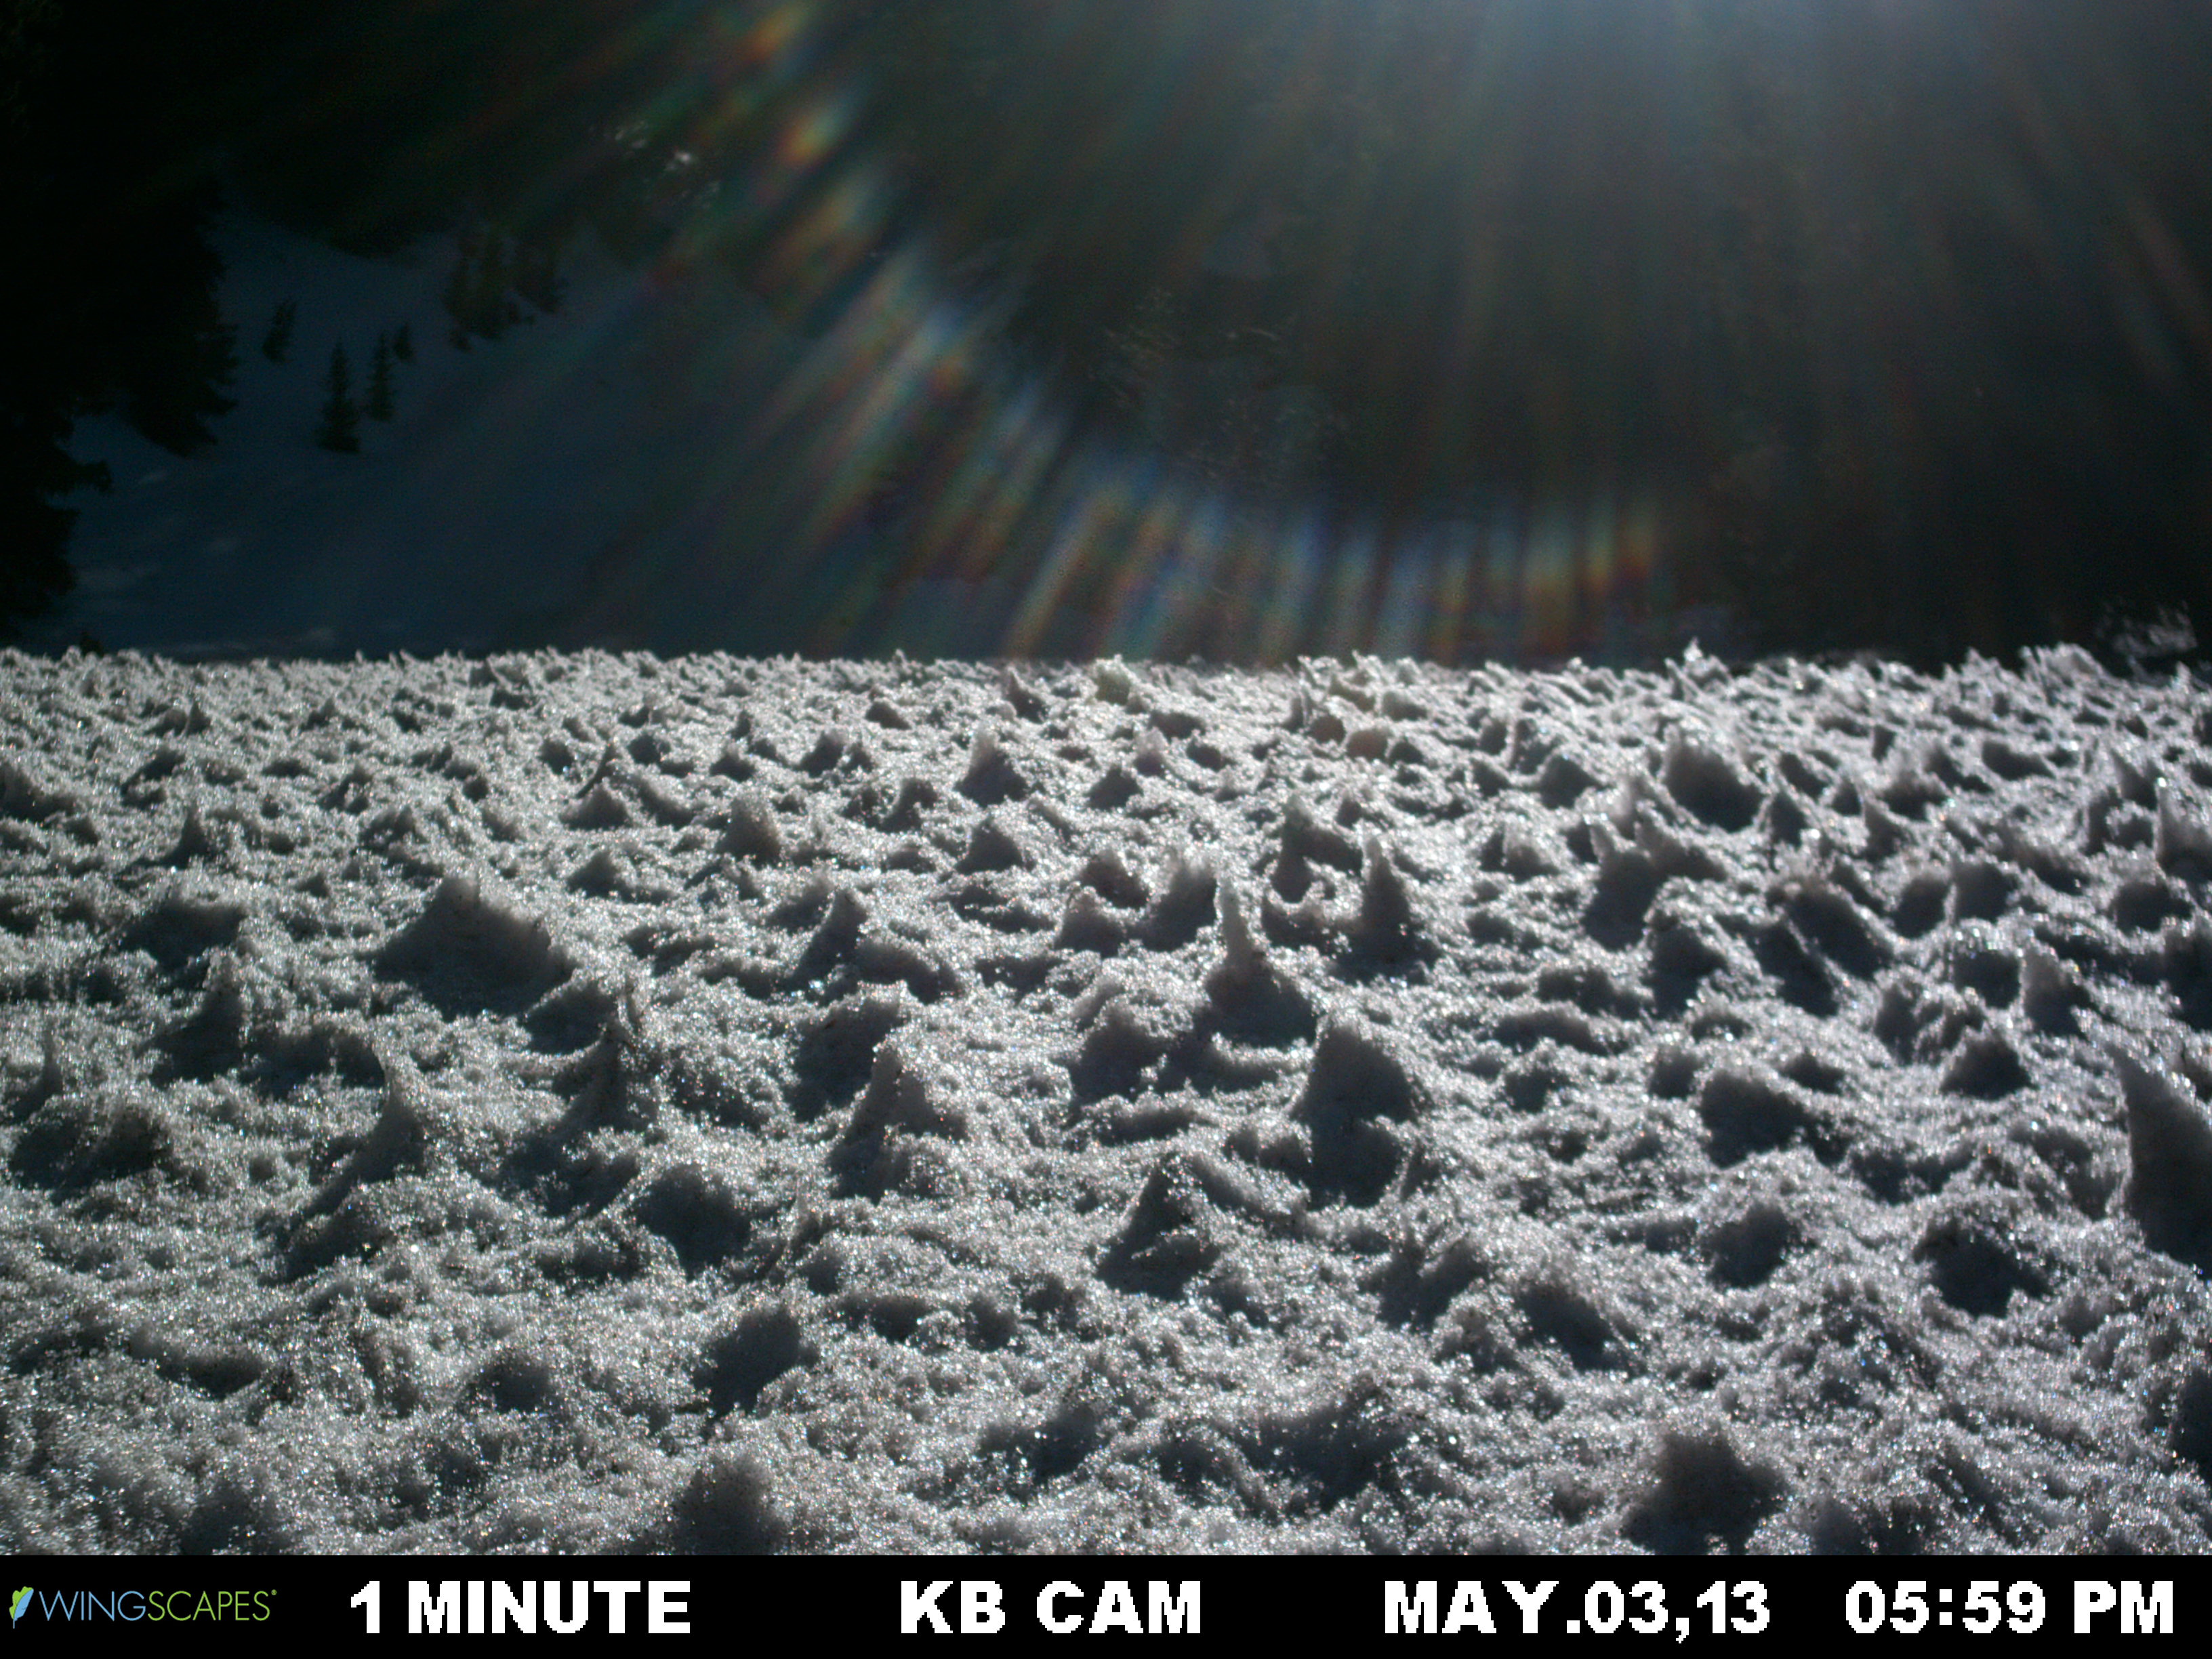
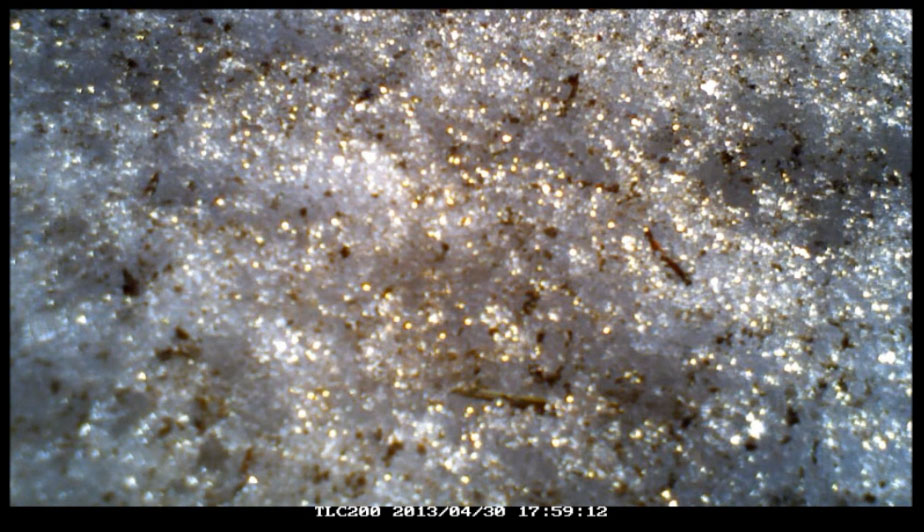
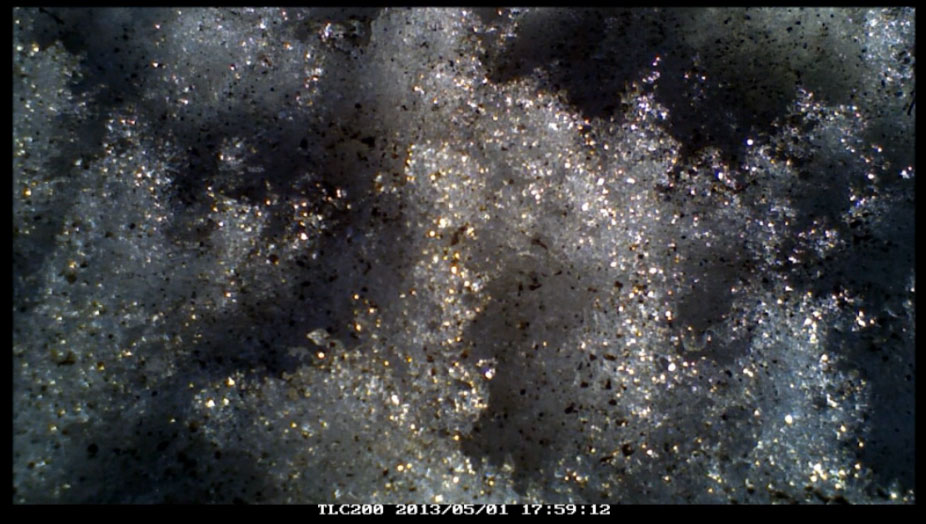

These remarkable time-lapse images, and CSAS’s prior observations of similar surface roughness and melt conditions, may reveal dust induced processes that could result in SWE losses at the snowpack surface, by increased evaporation and/or sublimation rates, that would not otherwise occur in dust-free, ‘clean’ spring snowpacks. In order to explore that important question, CSAS and CODOS has contacted snow scientists at the Army Corps of Engineers Cold Regions Research and Engineering Laboratory (CRREL) that we have worked with in the past and begun to develop a collaborative research project aimed at understanding these processes and their potential impacts on snowmelt runoff yields. CRREL has particular expertise in modeling and analyzing snow surface properties and processes, and these unique CODOS images and videos have captured their interest as well. CSAS looks forward to a successful collaboration that will further inform the snow science and water management communities about these dust-in-snow behaviors.
Recently Published Dust and Snow Hydrology Research
Last fall, on September 5 and again on September 14 we alerted the CODOS community to several recently published scholarly journal articles by Painter et al. and Skiles focused on dust and dust-on-snow. Since then, several more articles discussing how dust and climate are influencing mountain snowpacks have been published.
Briefly:
- Janice Brahney and her team report that dust deposition has increased throughout the US over the past 17 years and that western Colorado has experienced the greatest regional increases. This is the first article to describe recent, decadal trends in dust deposition. CSAS provided field support to Dr. Brahney during her PhD research. See: J. Brahney, A.P. Ballantyne, C. Sievers, J.C. Neff. Increasing Ca2+ deposition in the western US: the role of mineral aerosols. Aeolian Research (2013), http://dx.doi.org/10.1016/j.aeolia.2013.04.003
- Jessie Creamean and her large team report that aerosols from the Sahara and Asia have acted as ice nuclei during winter storms over the Sierra Nevada, enhancing snowfall rates. We have discussed the findings with Dr. Creamean and how the processes she identified in the Sierra Nevada may differ in Colorado. See: Jessie M. Creamean, et al. Dust and biological aerosols from the Sahara and Asia influence precipitation in the western U.S. Science, 29 March 2013: Vol. 339 no. 6127 pp. 1572-1578, DOI: 10.1126/science.1227279
- Danielle Perot and her team modeled the impacts of mountain pine beetle mortality on snowmelt processes, at various phases of forest death. CODOS observations of pine beetle mortality in the Willow Creek watershed are enhanced by this article. See: Perrot, D., Molotch, N.O., Musselman, K.N., and Pugh, E.T. (2012), Modelling the effects of the mountain pine beetle on snowmelt in a subalpine forest. Ecohydrol., doi: 10.1002/eco.1329
- Gregory Pederson and his team attempt to parse seasonal and climatic influences driving regional snowpack declines in the Rocky Mountains. Although spring warming is discussed as a major factor driving earlier snowmelt, dust-in-snow is not mentioned. See: Pederson, G.T., J.L. Betancourt, and G.J. McCabe (2013), Regional patterns and proximal causes of the recent snowpack decline in the Rocky Mountains, U.S., Geophys. Res. Lett., 40, doi:10.1002/grl.5024
CODOS Program Funding
The Colorado Dust-on-Snow program, CODOS, is an applied science program performed by the Center for Snow and Avalanche Studies on behalf of the Colorado water community and its partners in Colorado River Basin and Rio Grande River management. CODOS is made possible by collective, direct funding from the following stakeholder agencies. Additional program support is provided by our partners in the USGS Geosciences and Environmental Change Science Center. CSAS is grateful to all of our CODOS and mountain system monitoring program funders for their sustained support.
| CODOS Funders | |||||||
|
WY '07 |
WY '08 |
WY '09 |
WY '10 |
WY '11 |
WY '12 |
WY '13 |
|
| Animas-La Plata Water Conservancy District | 500 |
600 |
600 |
400 |
500 |
||
| Bureau of Reclamation, Western Colorado Area Office | 5,000 |
8,000 |
7,500 |
||||
| Bureau of Reclamation, Lower Colorado Region | 7,000 |
10,000 |
10,000 |
10,000 |
|||
| Bureau of Reclamation, Great Plains Region | 2,500 |
2,500 |
2,500 |
||||
| City of Grand Junction | 2,500 |
2,500 |
2,500 |
||||
| Colorado River Water Conservation District | 8,000 |
8,000 |
8,000 |
10,000 |
10,000 |
10,000 |
15,000 |
| Colorado Water Conservation Board | 28,034 |
15,000 |
50,000 |
||||
| Denver Water | 2,500 |
2,500 |
2,500 |
5,000 |
5,000 |
5,000 |
6,000 |
| Dolores Water Conservancy District | 600 |
600 |
750 |
750 |
|||
| Northern Colorado Water Conservancy District | 1,500 |
2,500 |
2,000 |
||||
| Rio Grande Water Conservation District | 3,000 |
4,000 |
5,000 |
5,000 |
5,000 |
5,000 |
|
| Southwestern Water Conservation District | 5,000 |
5,000 |
4,000 |
5,000 |
5,000 |
5,000 |
5,000 |
| Tri-County Water Conservancy District | 1,000 |
1,000 |
1,500 |
2,500 |
2,500 |
2,500 |
2,500 |
| Upper Gunnison River Water Conservancy District | 5,000 |
7,500 |
7,500 |
7,500 |
7,500 |
7,500 |
|
| Western Water Assessment – Univ. of Colorado | 20,072 |
||||||