 Water Year 2013 CODOS Summary
for Park Cone
Summary | Snowpack & Dust | Melt Rates | Stream Flows
Summary
Water Year 2013 entered late winter with dismal snowpack development at all eleven CODOS dust-on-snow monitoring sites, located throughout the Colorado mountains. Through March 2013, snowpack SWE totals mirrored or even fell short of the very dry winter of WY 2012, raising concerns about back-to-back drought seasons. That broadly consistent spatial pattern in scant precipitation began to diverge in April, 2013. CODOS sites in the northern Front Range and Colorado River headwaters benefitted most from a series of April and May winter storms that augmented snowpacks and eventually resulted in average or even above average peak SWE levels on average or later-than-average dates. In the southwestern mountains, fewer and/or smaller April/May storms failed to offset the dry beginning to WY2013 winter. CODOS sites in the San Juan Mountains experienced, for the second year, substantially sub-par peak SWE values, on near-average dates. In between, the Central Mountains, Grand Mesa, Park, and northern Gore ranges came closer to but still fell short of average snowpacks. The Park Cone CODOS site at Taylor Reservoir was among the latter sites, falling close to but still short of average peak SWE, on a later-than-average date.
At the primary CODOS monitoring site, the CSAS Senator Beck Basin Study Area at Red Mountain Pass, WY2013 produced a total of ten separate dust-on-snow events, a lower total count than in the past three seasons. However, the actual mass of dust deposited at Senator Beck Basin in WY 2013 was greater than in any prior season, including the "Martian Winter" of WY 2009. Dust season began at Senator Beck Basin in November with a single event, February and March delivered four additional events, but the vast majority of dust deposition occurred during events D6 on April 8th and the long-duration D8 event of April 15-17. As of late March, dust layers observed at Senator Beck Basin were either weak or not present at CODOS sites farther north and east, creating some hope that WY 2013 might be dust-free in parts of the state. Then, dust events D6 and D8 spelled the end to that possibility with significant depositions statewide near the top of the snowpack. As at all CODOS sites, dust layers D6 and D8 played the principal role in very significantly reducing snowcover albedo at Park Cone as they became exposed, merged, and remained exposed. Although dust-enhanced melt rates were sometimes high, periods of unsettled weather and fresh snowfalls frequently interrupted those periods of radiative forcing, slowing or reversing stream flow surging and prolonging the runoff cycle in the upper Gunnison River basin.
SnowPack & Dust Discussion
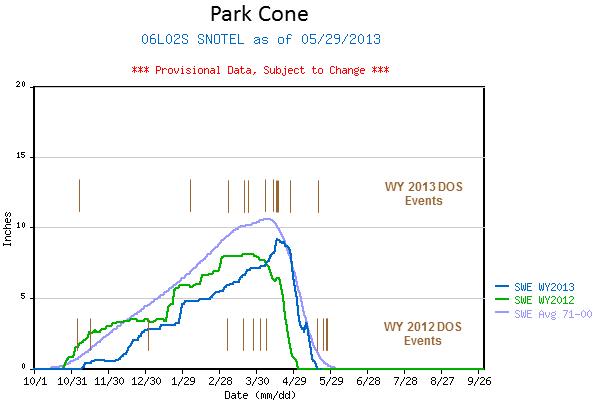
SWE accumulation and ablation for Water Years 2012 and 2013, with dust-on-snow events shown as brown bars, by date (as observed at the Senator Beck Basin Study Area). The long-duration D8 event of April 15-17, 2013, is shown as a heavier bar. Note that not all dust layers observed at Senator Beck Basin were also found at other CODOS sites.
Snowpack formation at the Park Cone CODOS and Snotel site began late, in early November, soon stalled for nearly a month, and then resumed in mid-December. Despite a sharp rise in SWE during a period of stormy weather at the end of December (CSAS Storms #4-8), by February 1, 2013 snowpack SWE at Park Cone was still far below average, even lagging behind WY 2012. Dust layer D2, deposited overnight on February 8/9, was barely discernible in our March 18, 2013 snow profile.
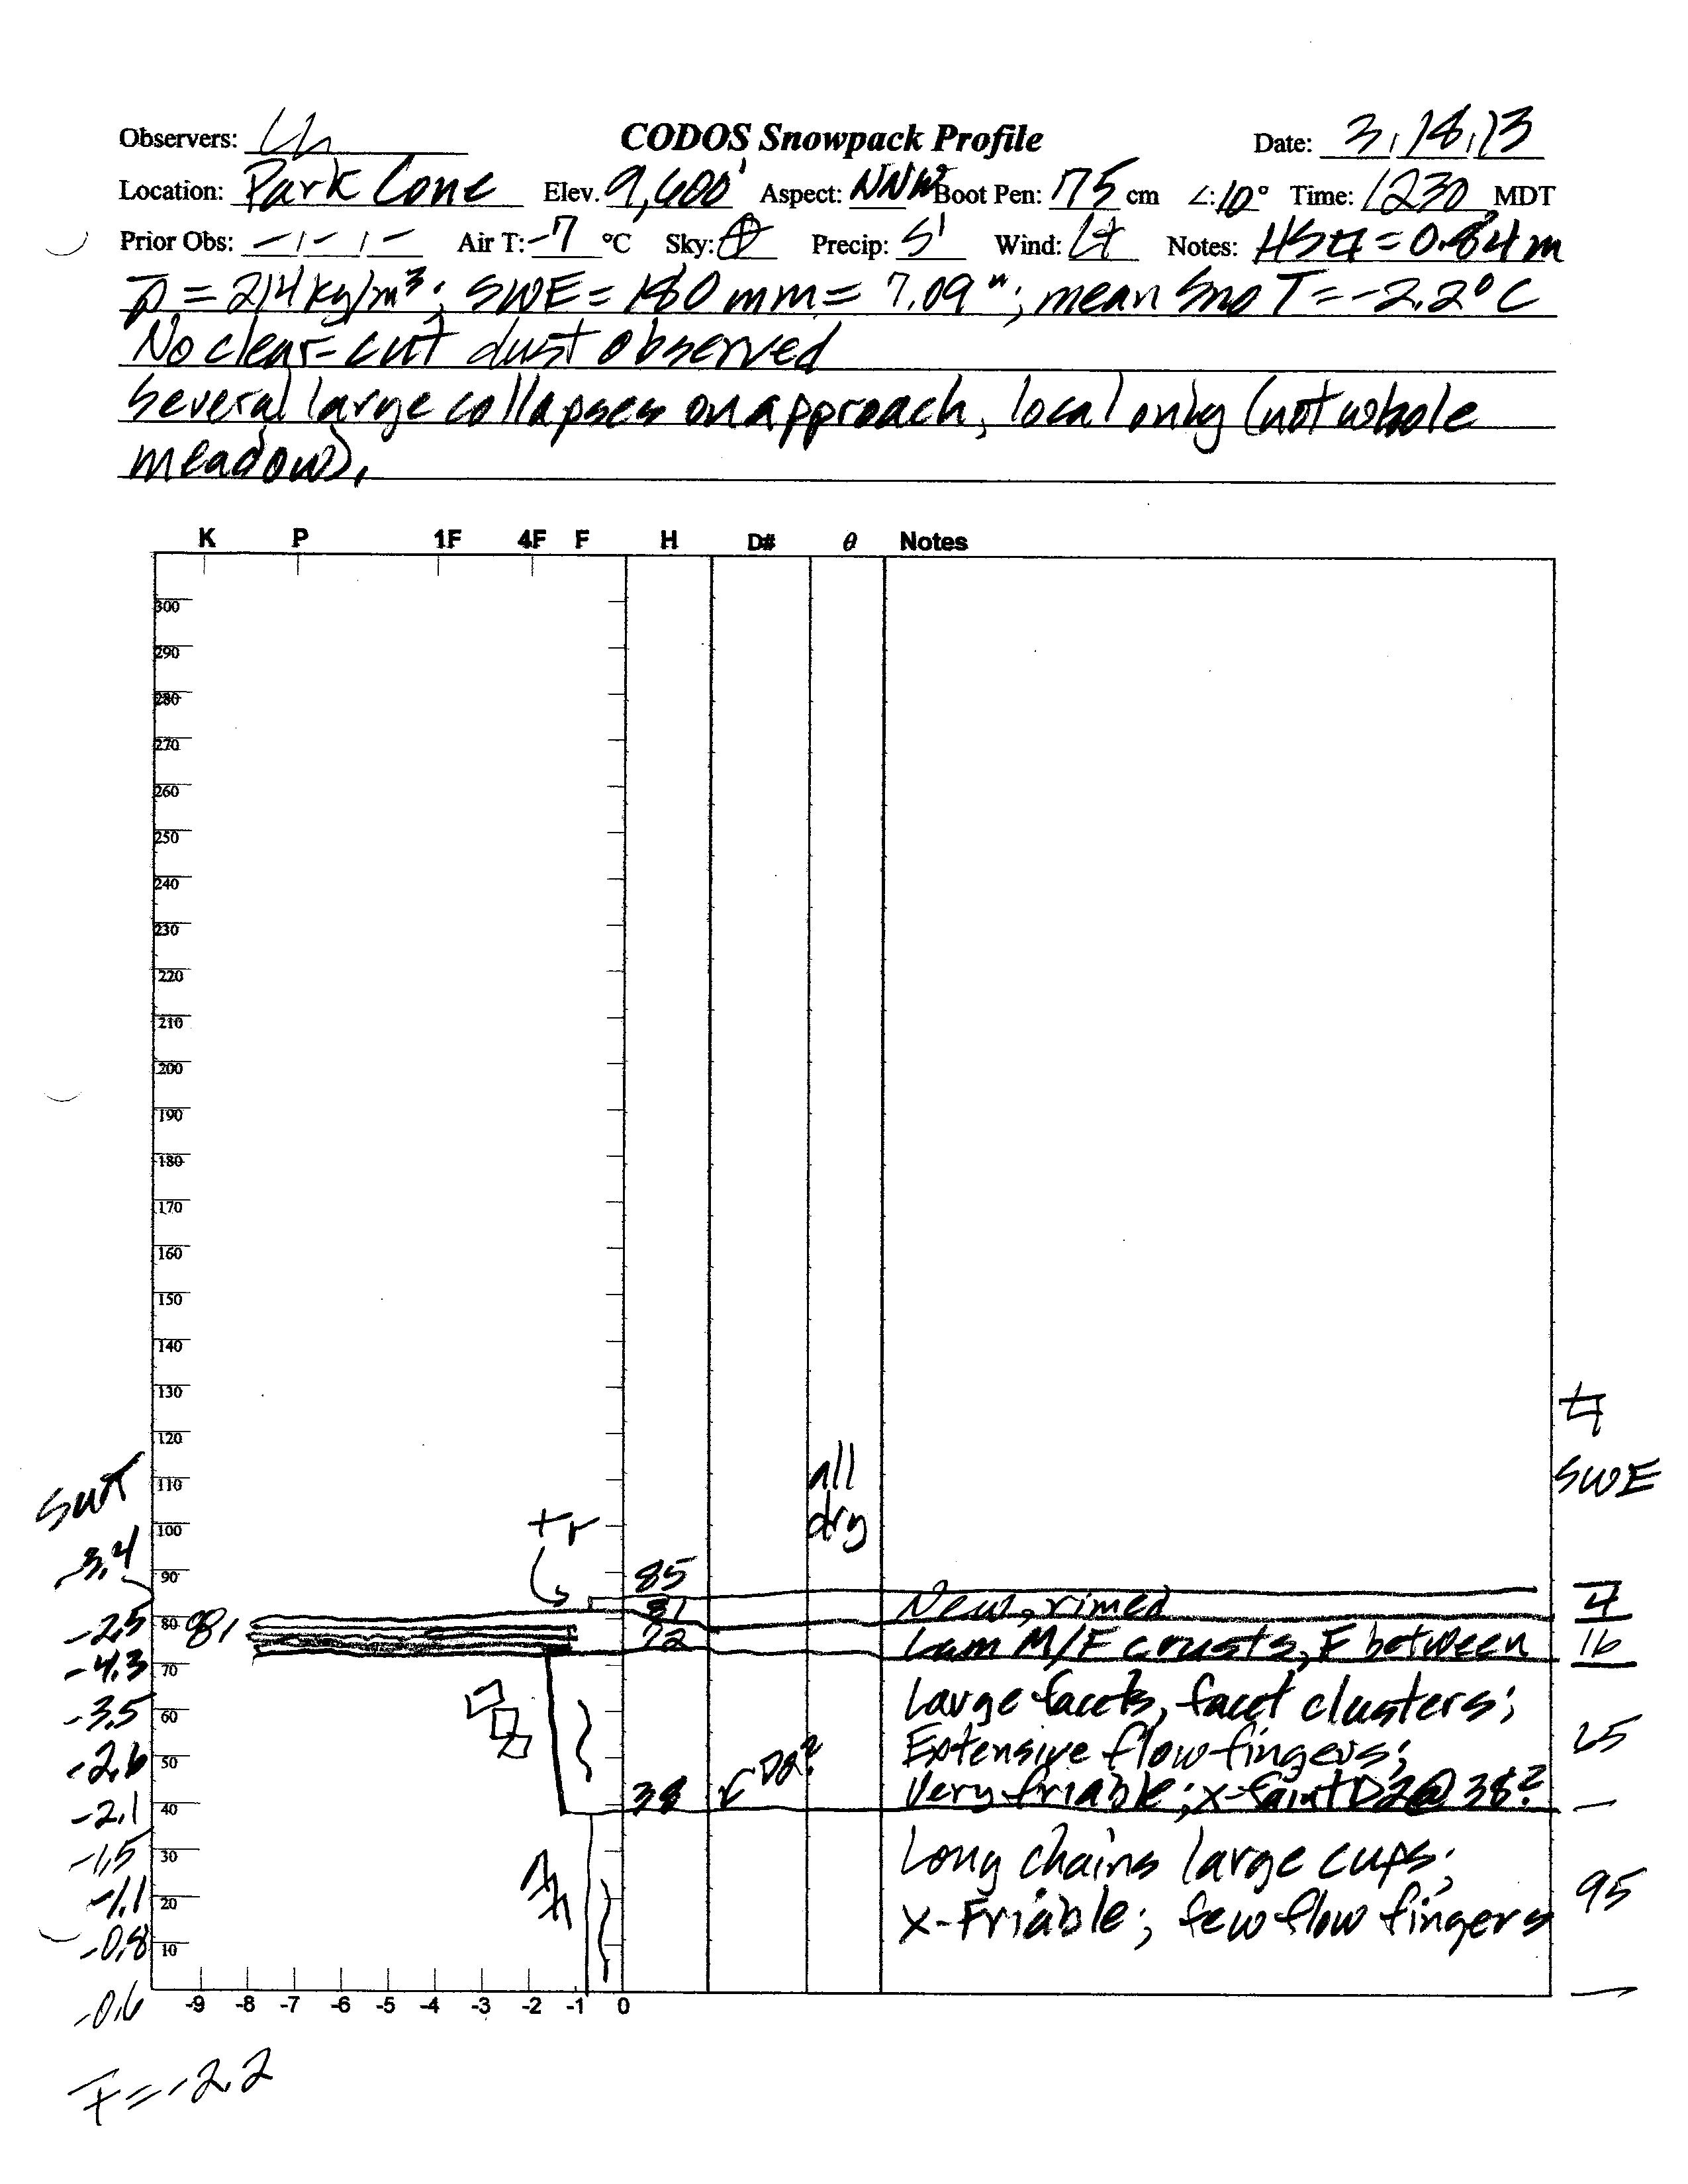
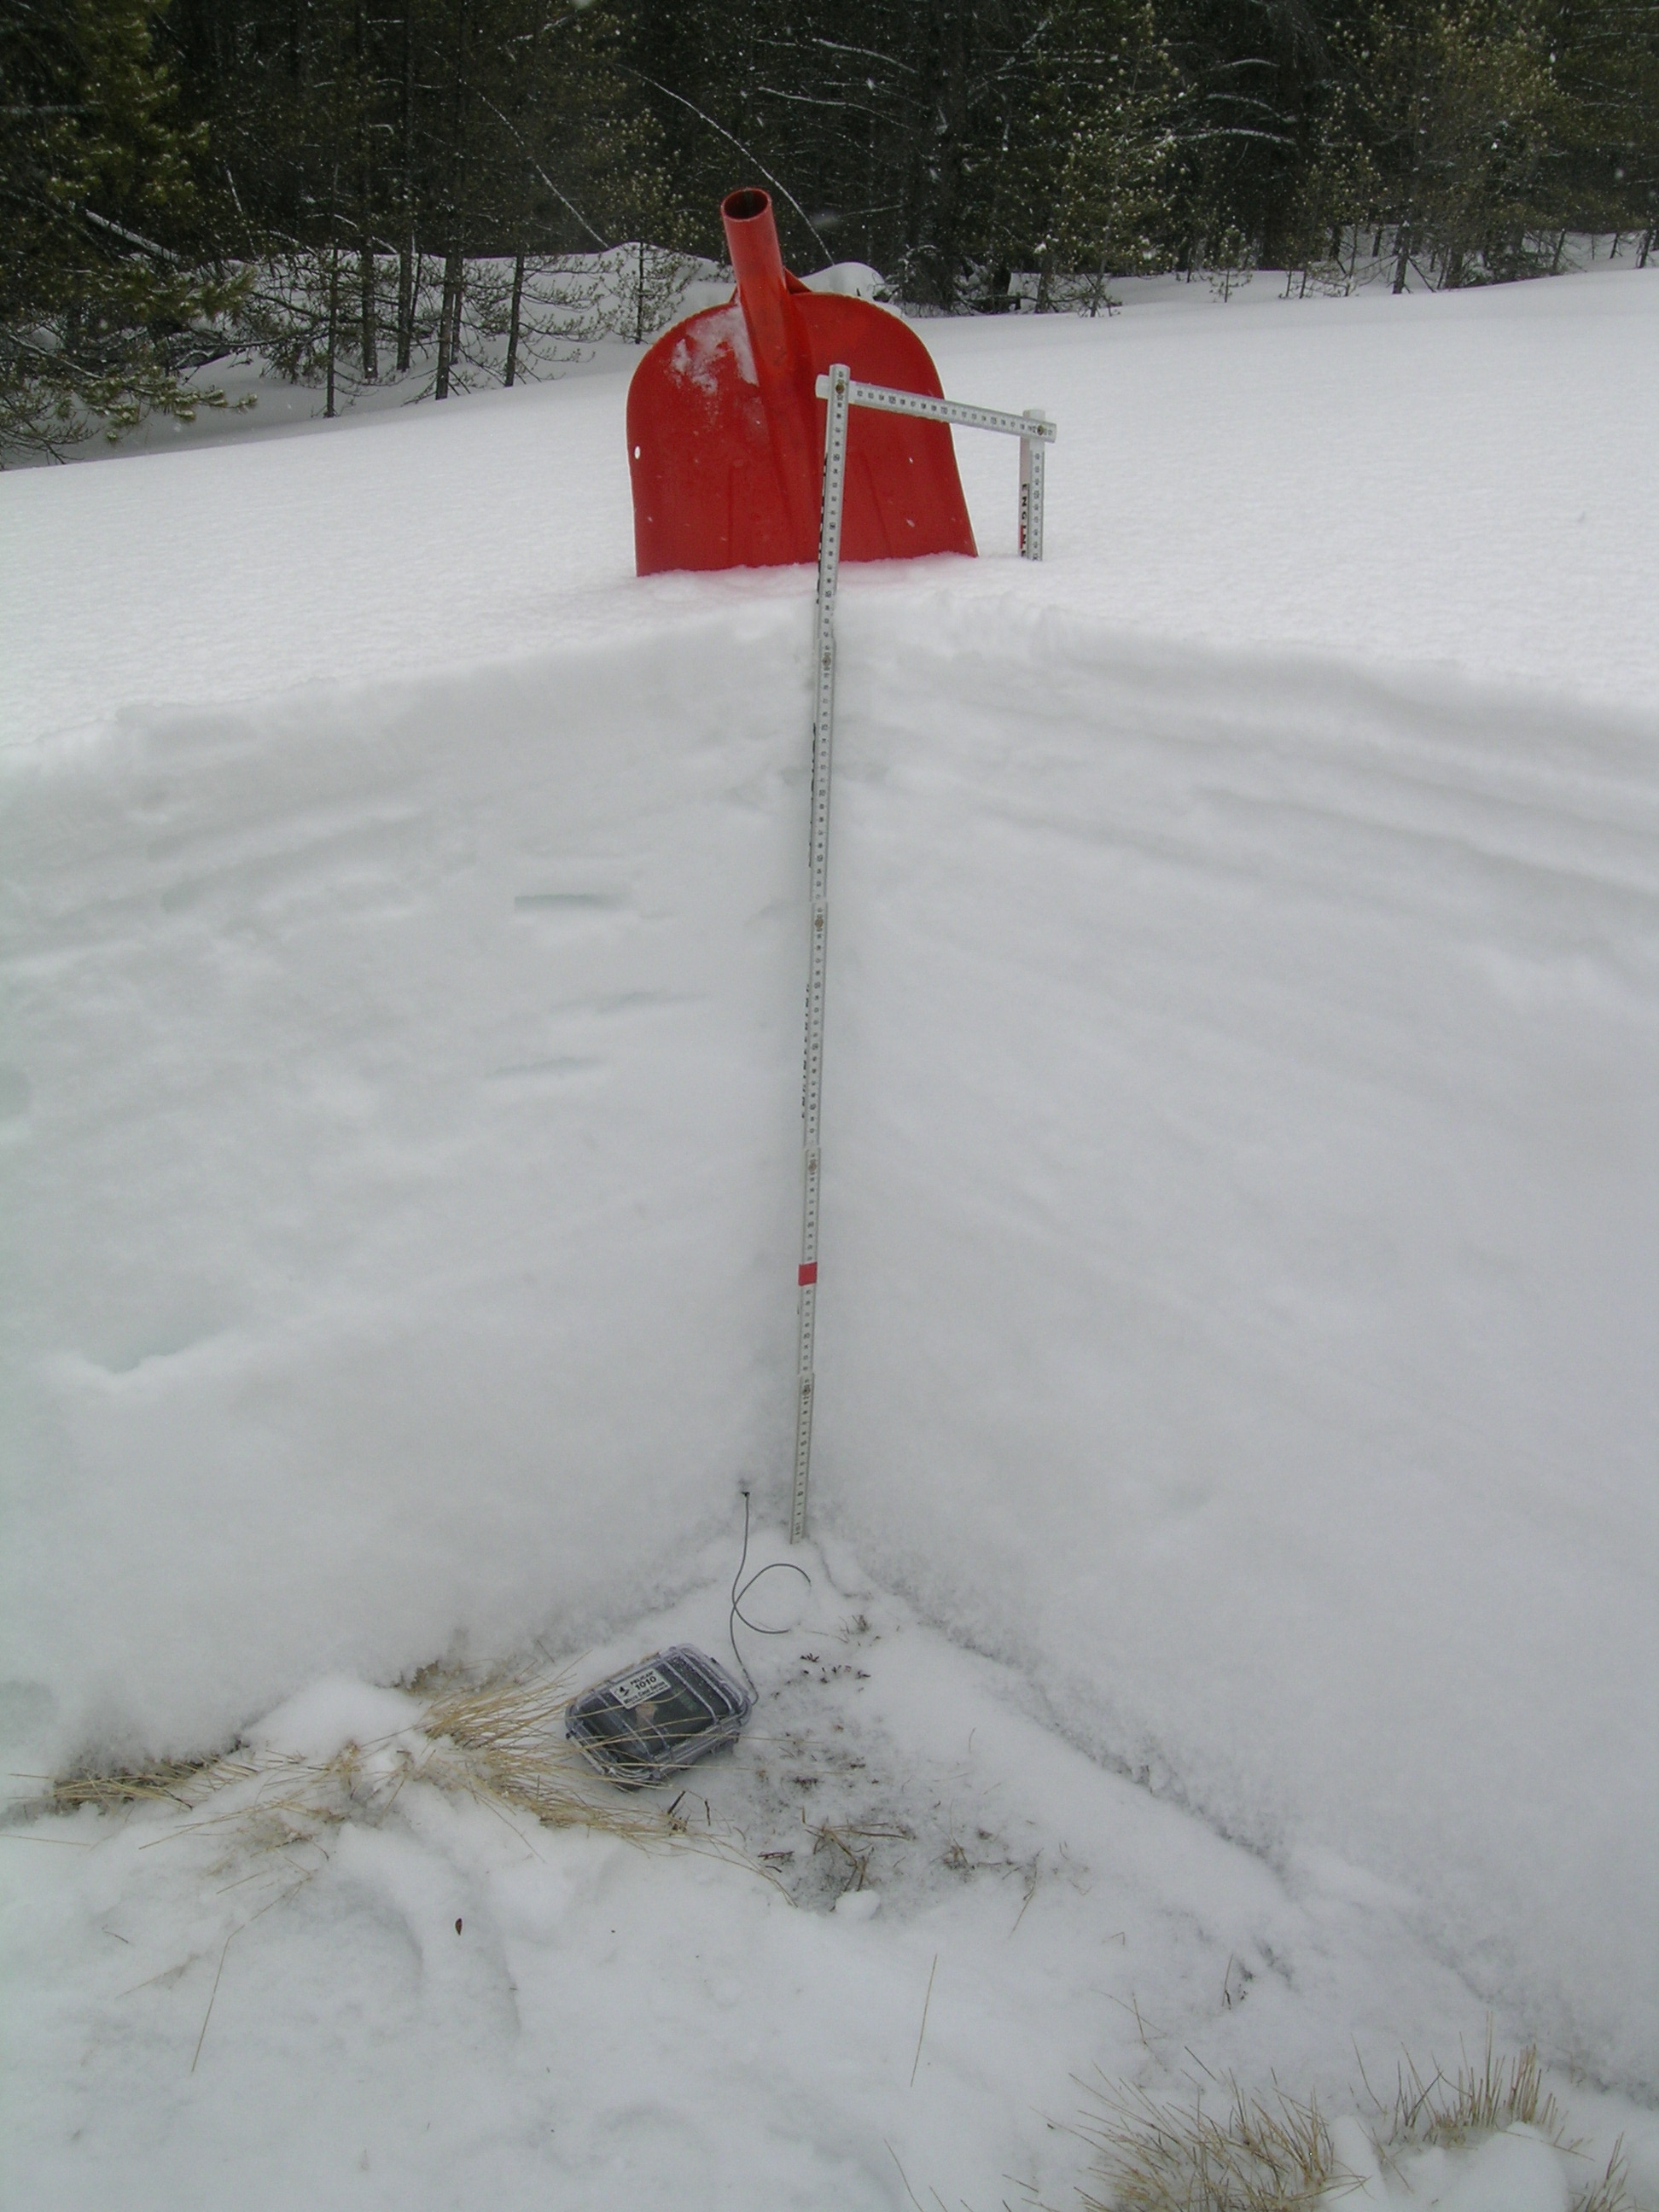
Dust layer D2 was barely discernible in the pit’s face and end wall, intersecting the pit corner just a few inches above the red tape on the ruler. This snowpack
retained some cold content, at a mean temperature of -2.2° C. Dust event D4 was approaching as we departed the site
and drove down the Taylor River canyon.
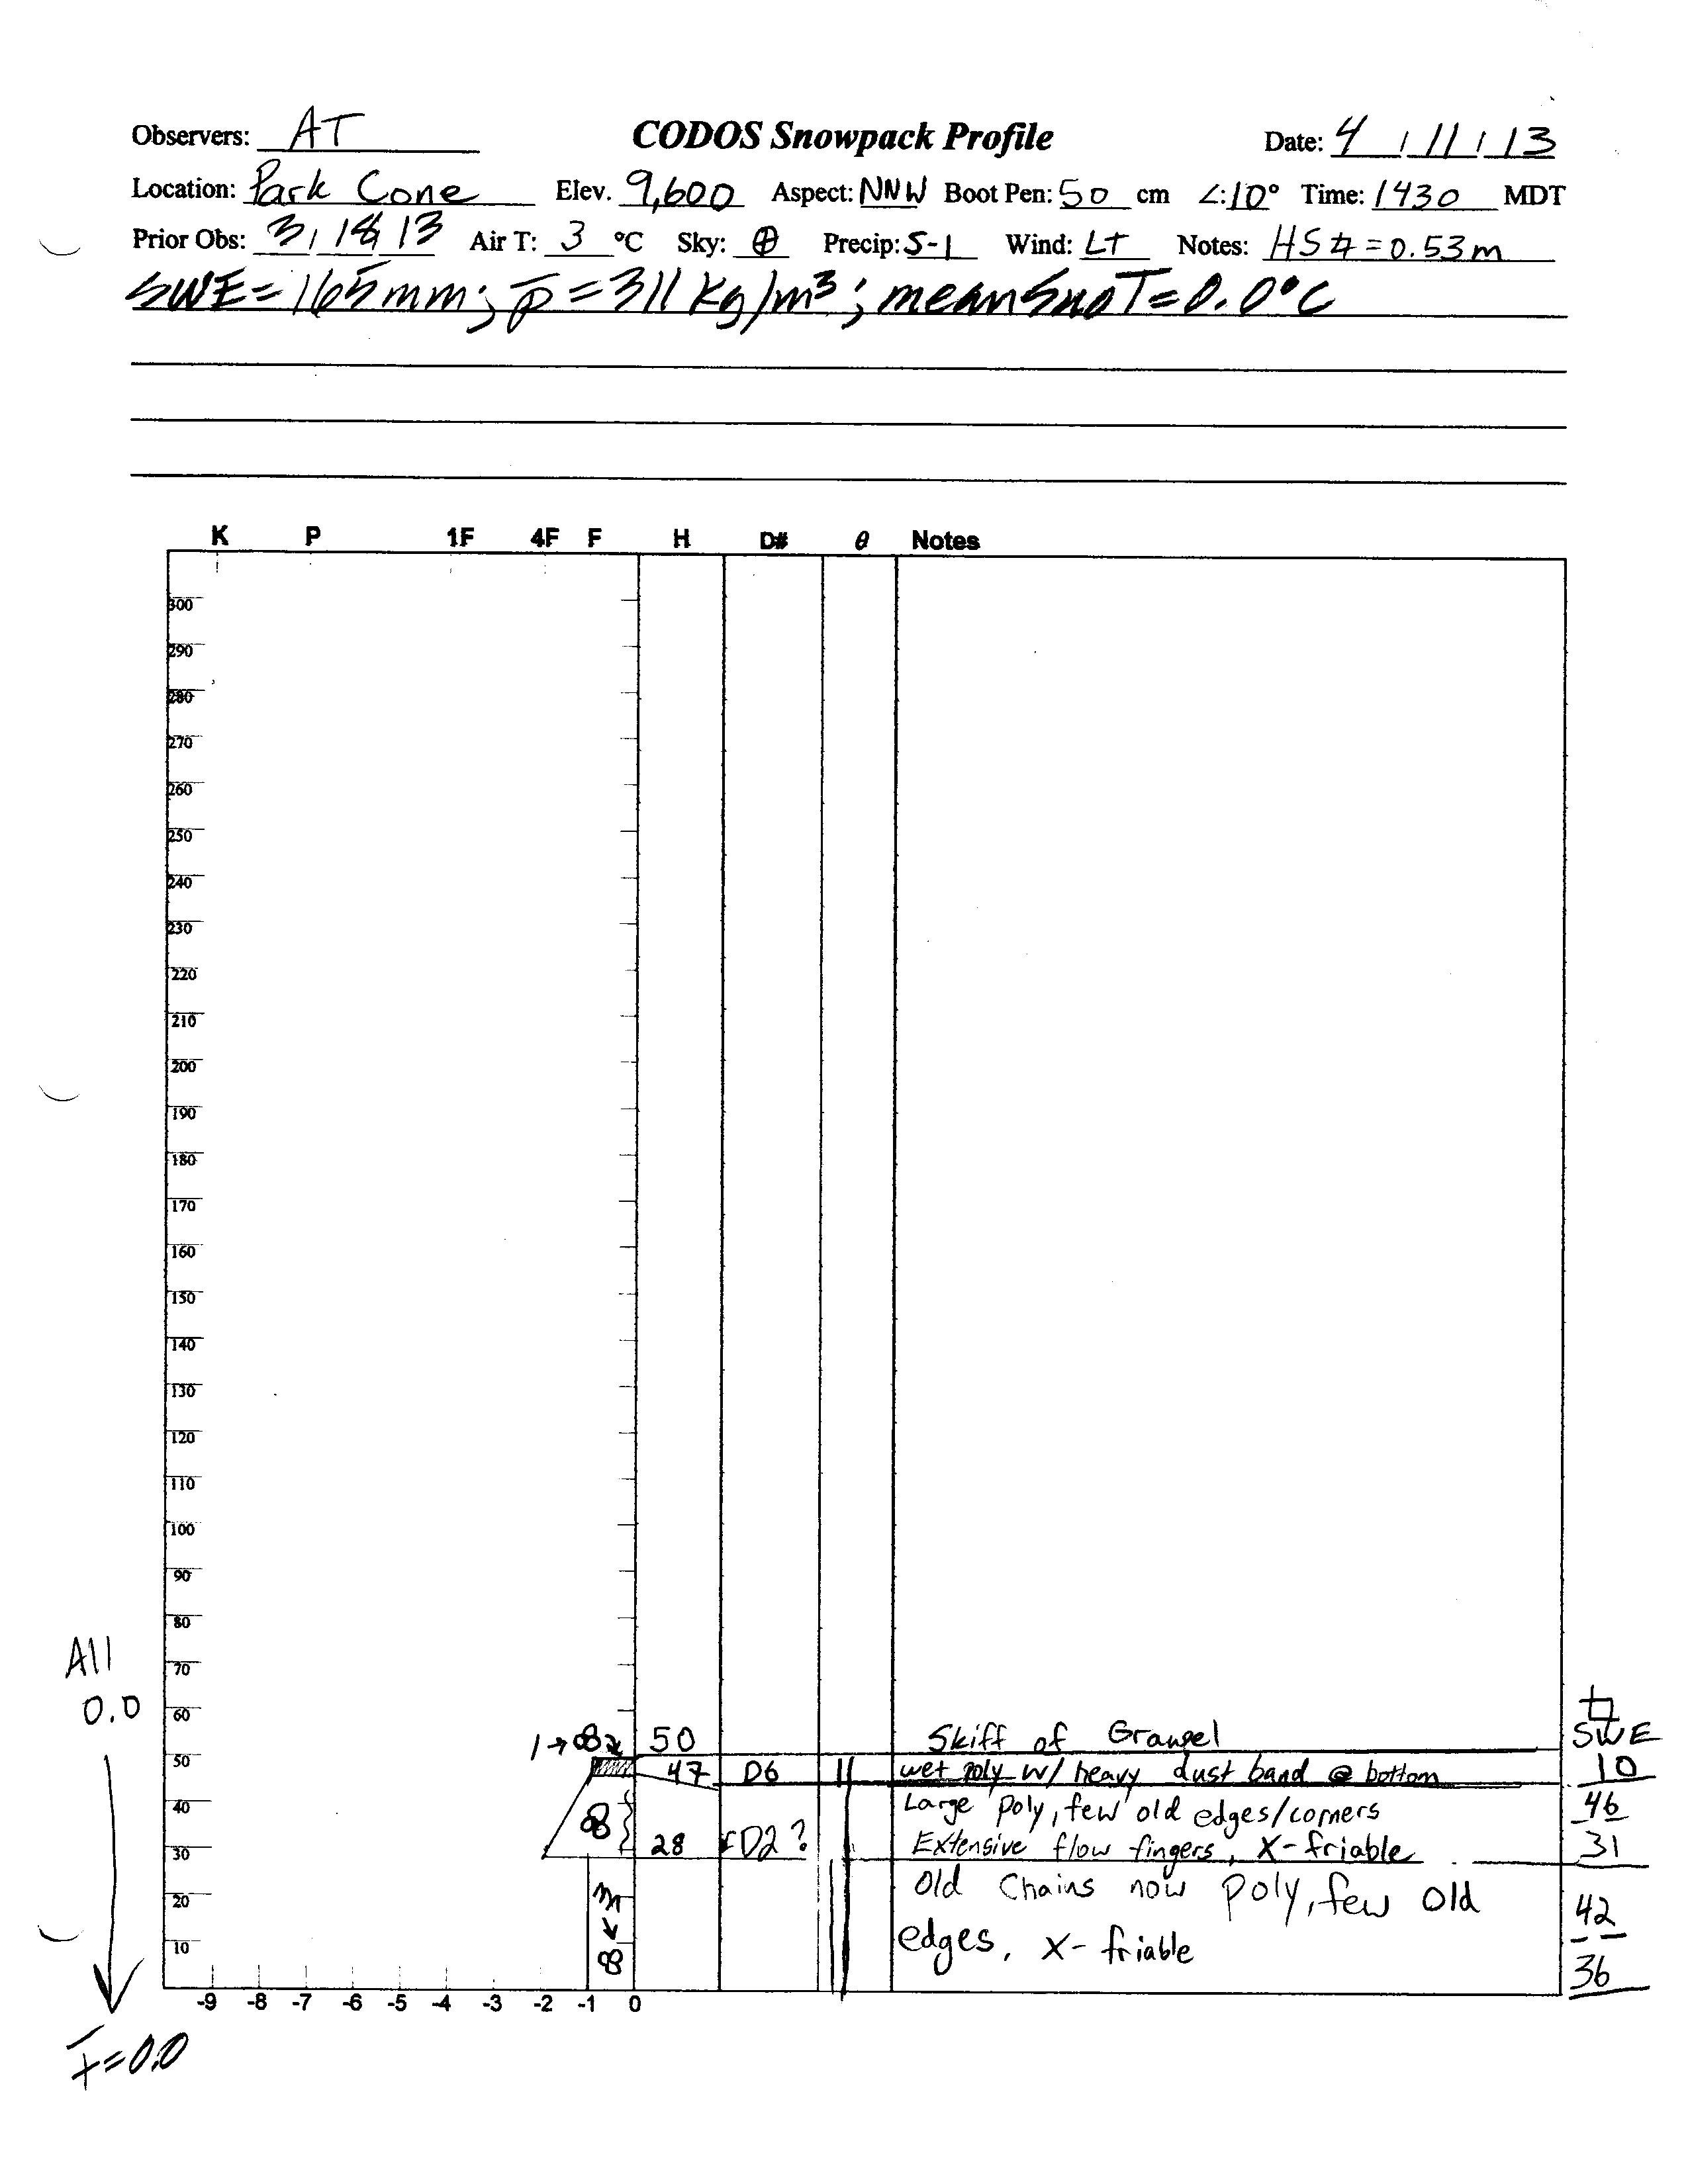
SWE accumulation was poor during much of February but resumed at a slow pace later in the month and continued through the first half of March before again stalling in late March and early April. On April 8 a storm (CSAS Storm #19) delivered both fresh snow as well as dust event D6, clearly present in our April 11 snow profile. That profile presented an isothermal snowcover, with all snow temperatures at 0.0° C, and clear evidence of recent surface melt.
Peak SWE followed on April 16 (at 9.2”), eleven days later than the median date of Peak SWE (April 5) and 0.9” below the median peak SWE value (10.1”). Another winter storm (CSAS Storm #20), coinciding with the long-duration D8 dust event of April 15-17, contributed to that peak SWE. Snowpack ablation quickly followed, initially enhanced by the rapid emergence of dust layer D8 and soon by the merging of layer D8 with layer D6. Aside from a minor rebound in mid-May, snowmelt was rapid and the Park Cone Snotel recorded “snow all gone” (SAG) on May 18.
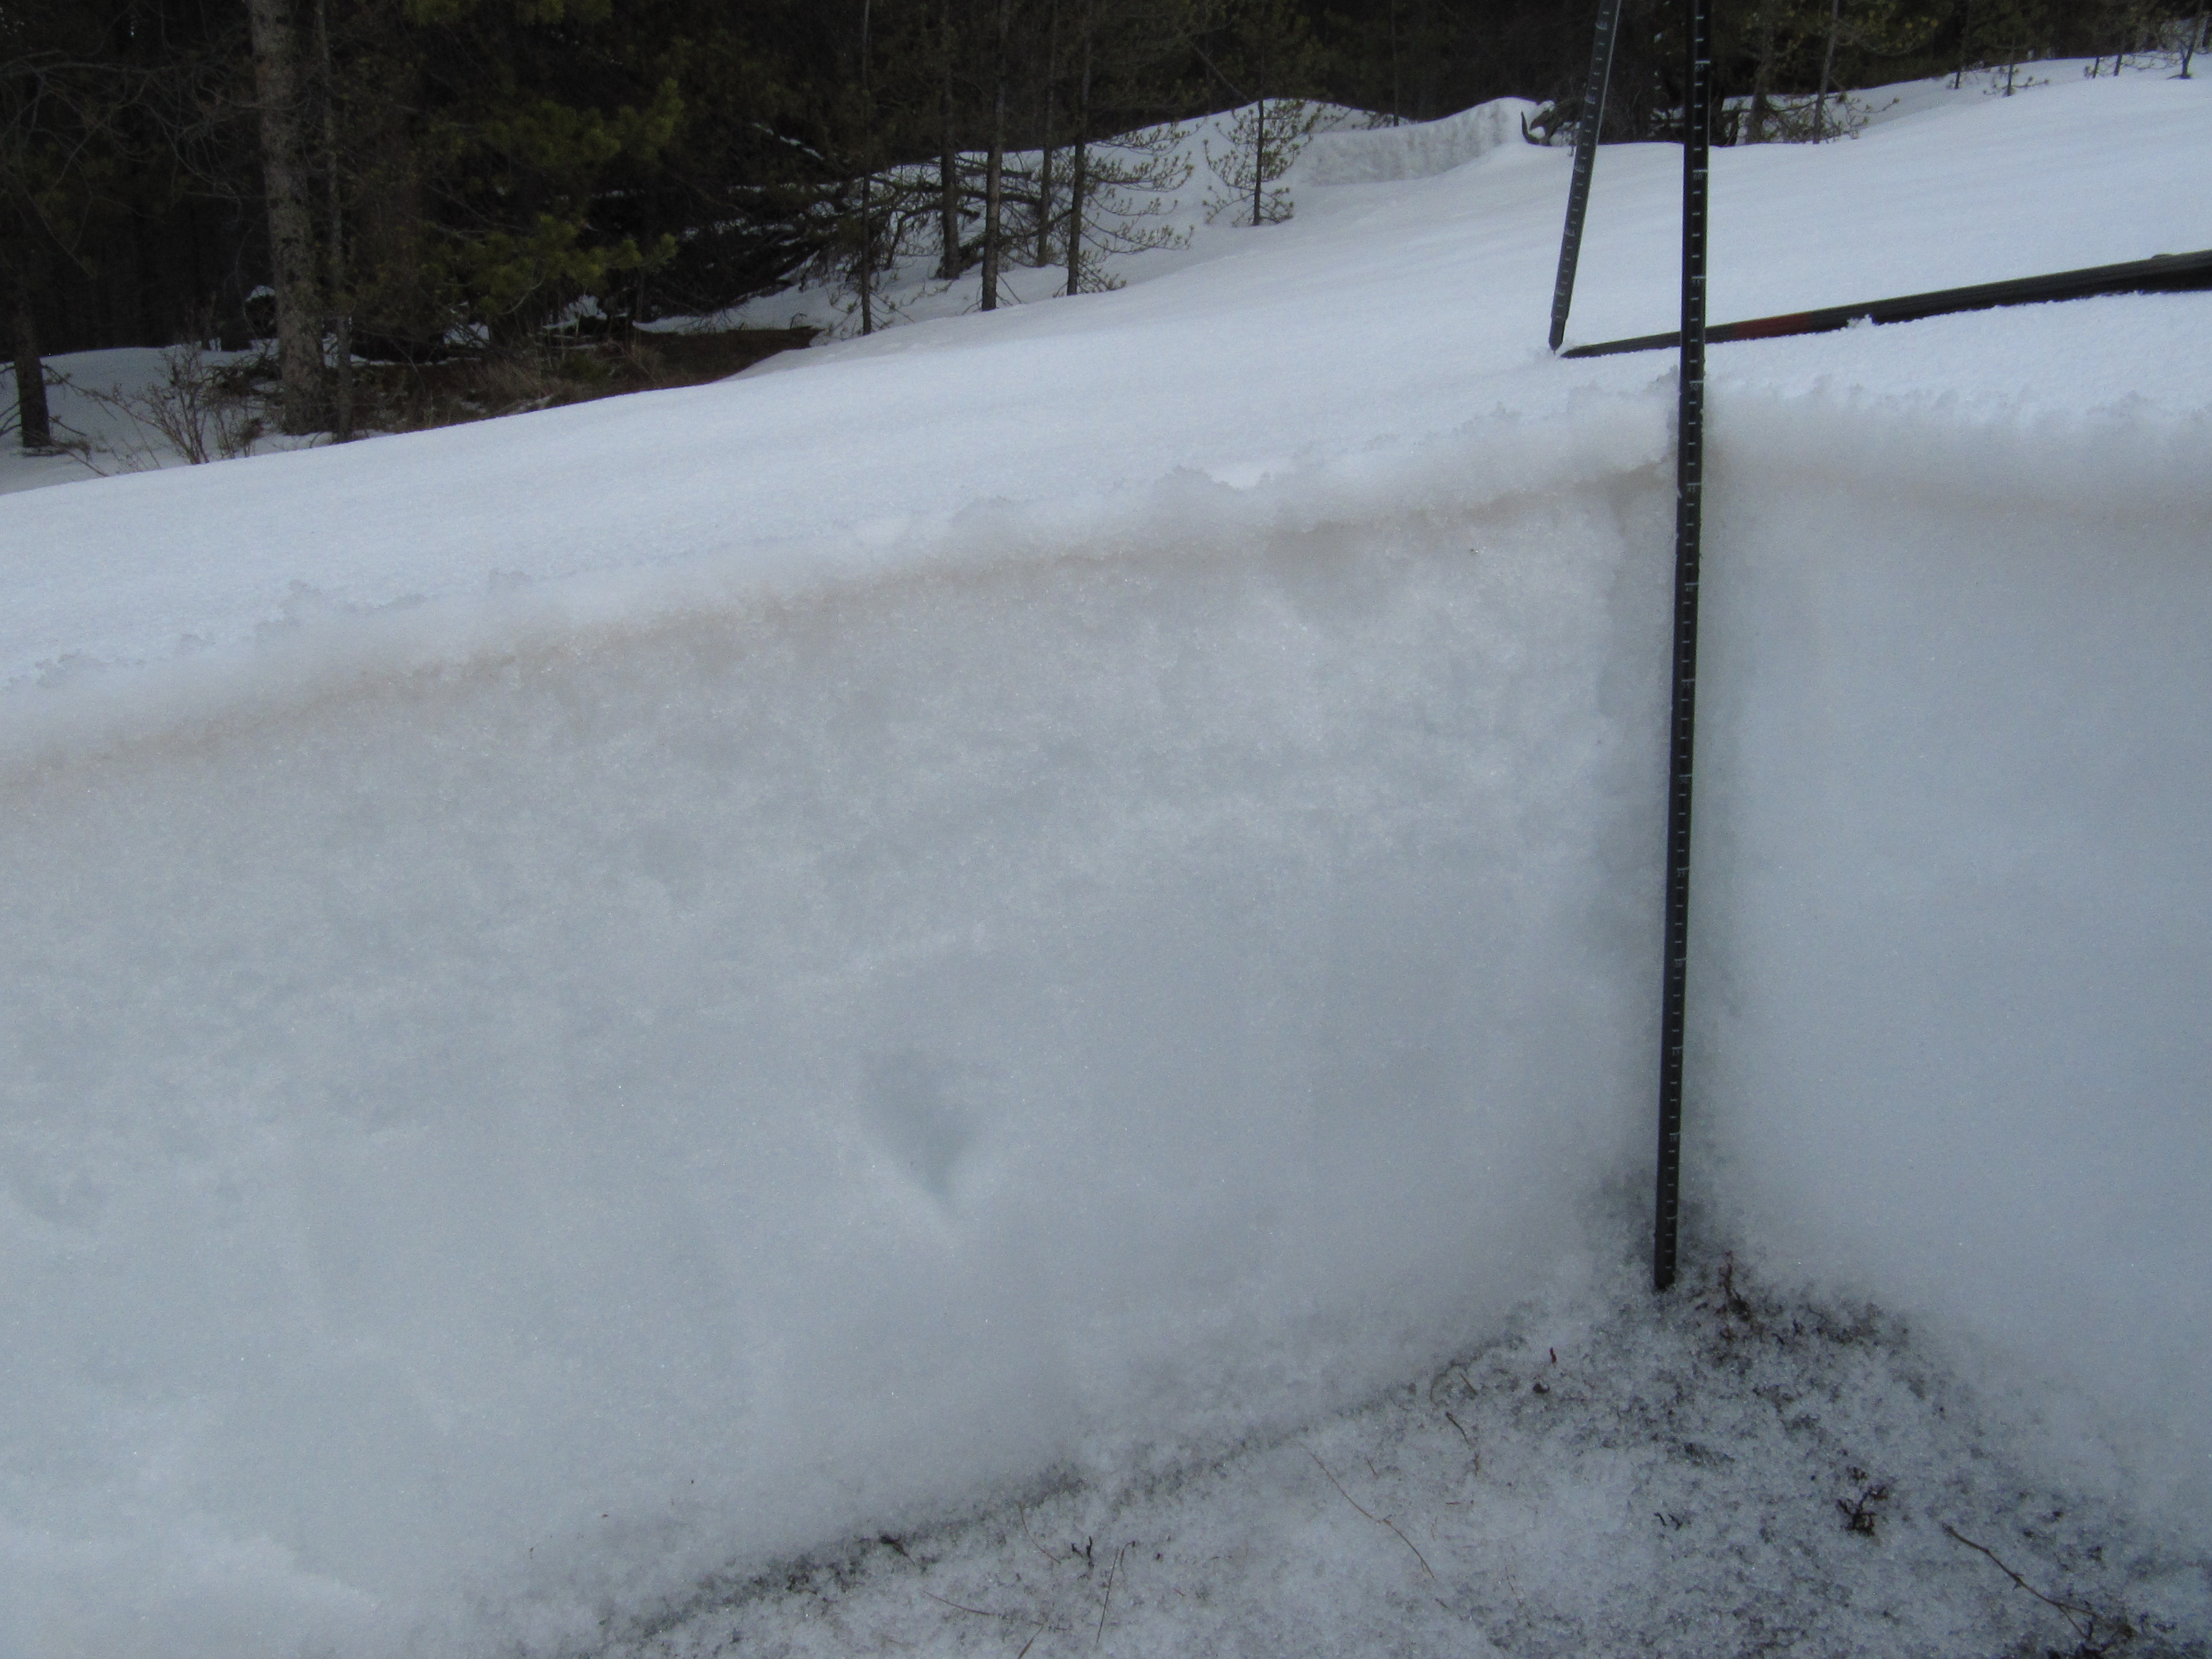
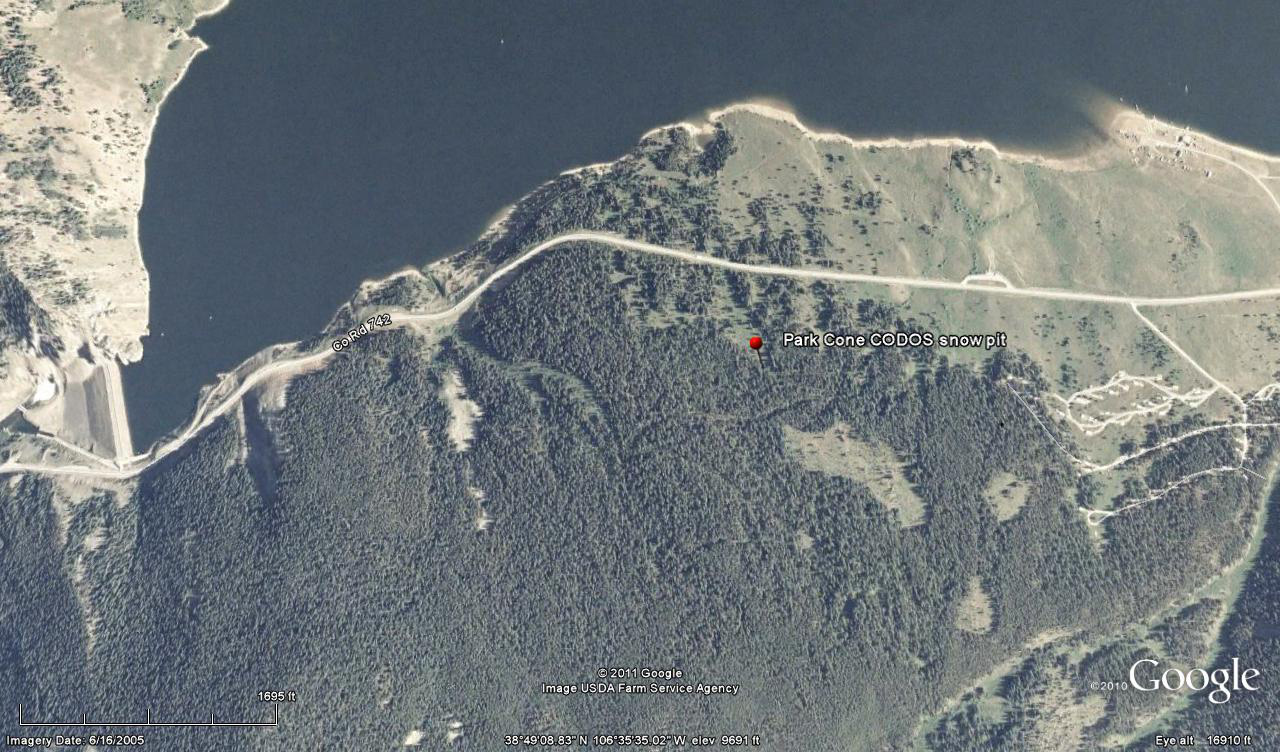
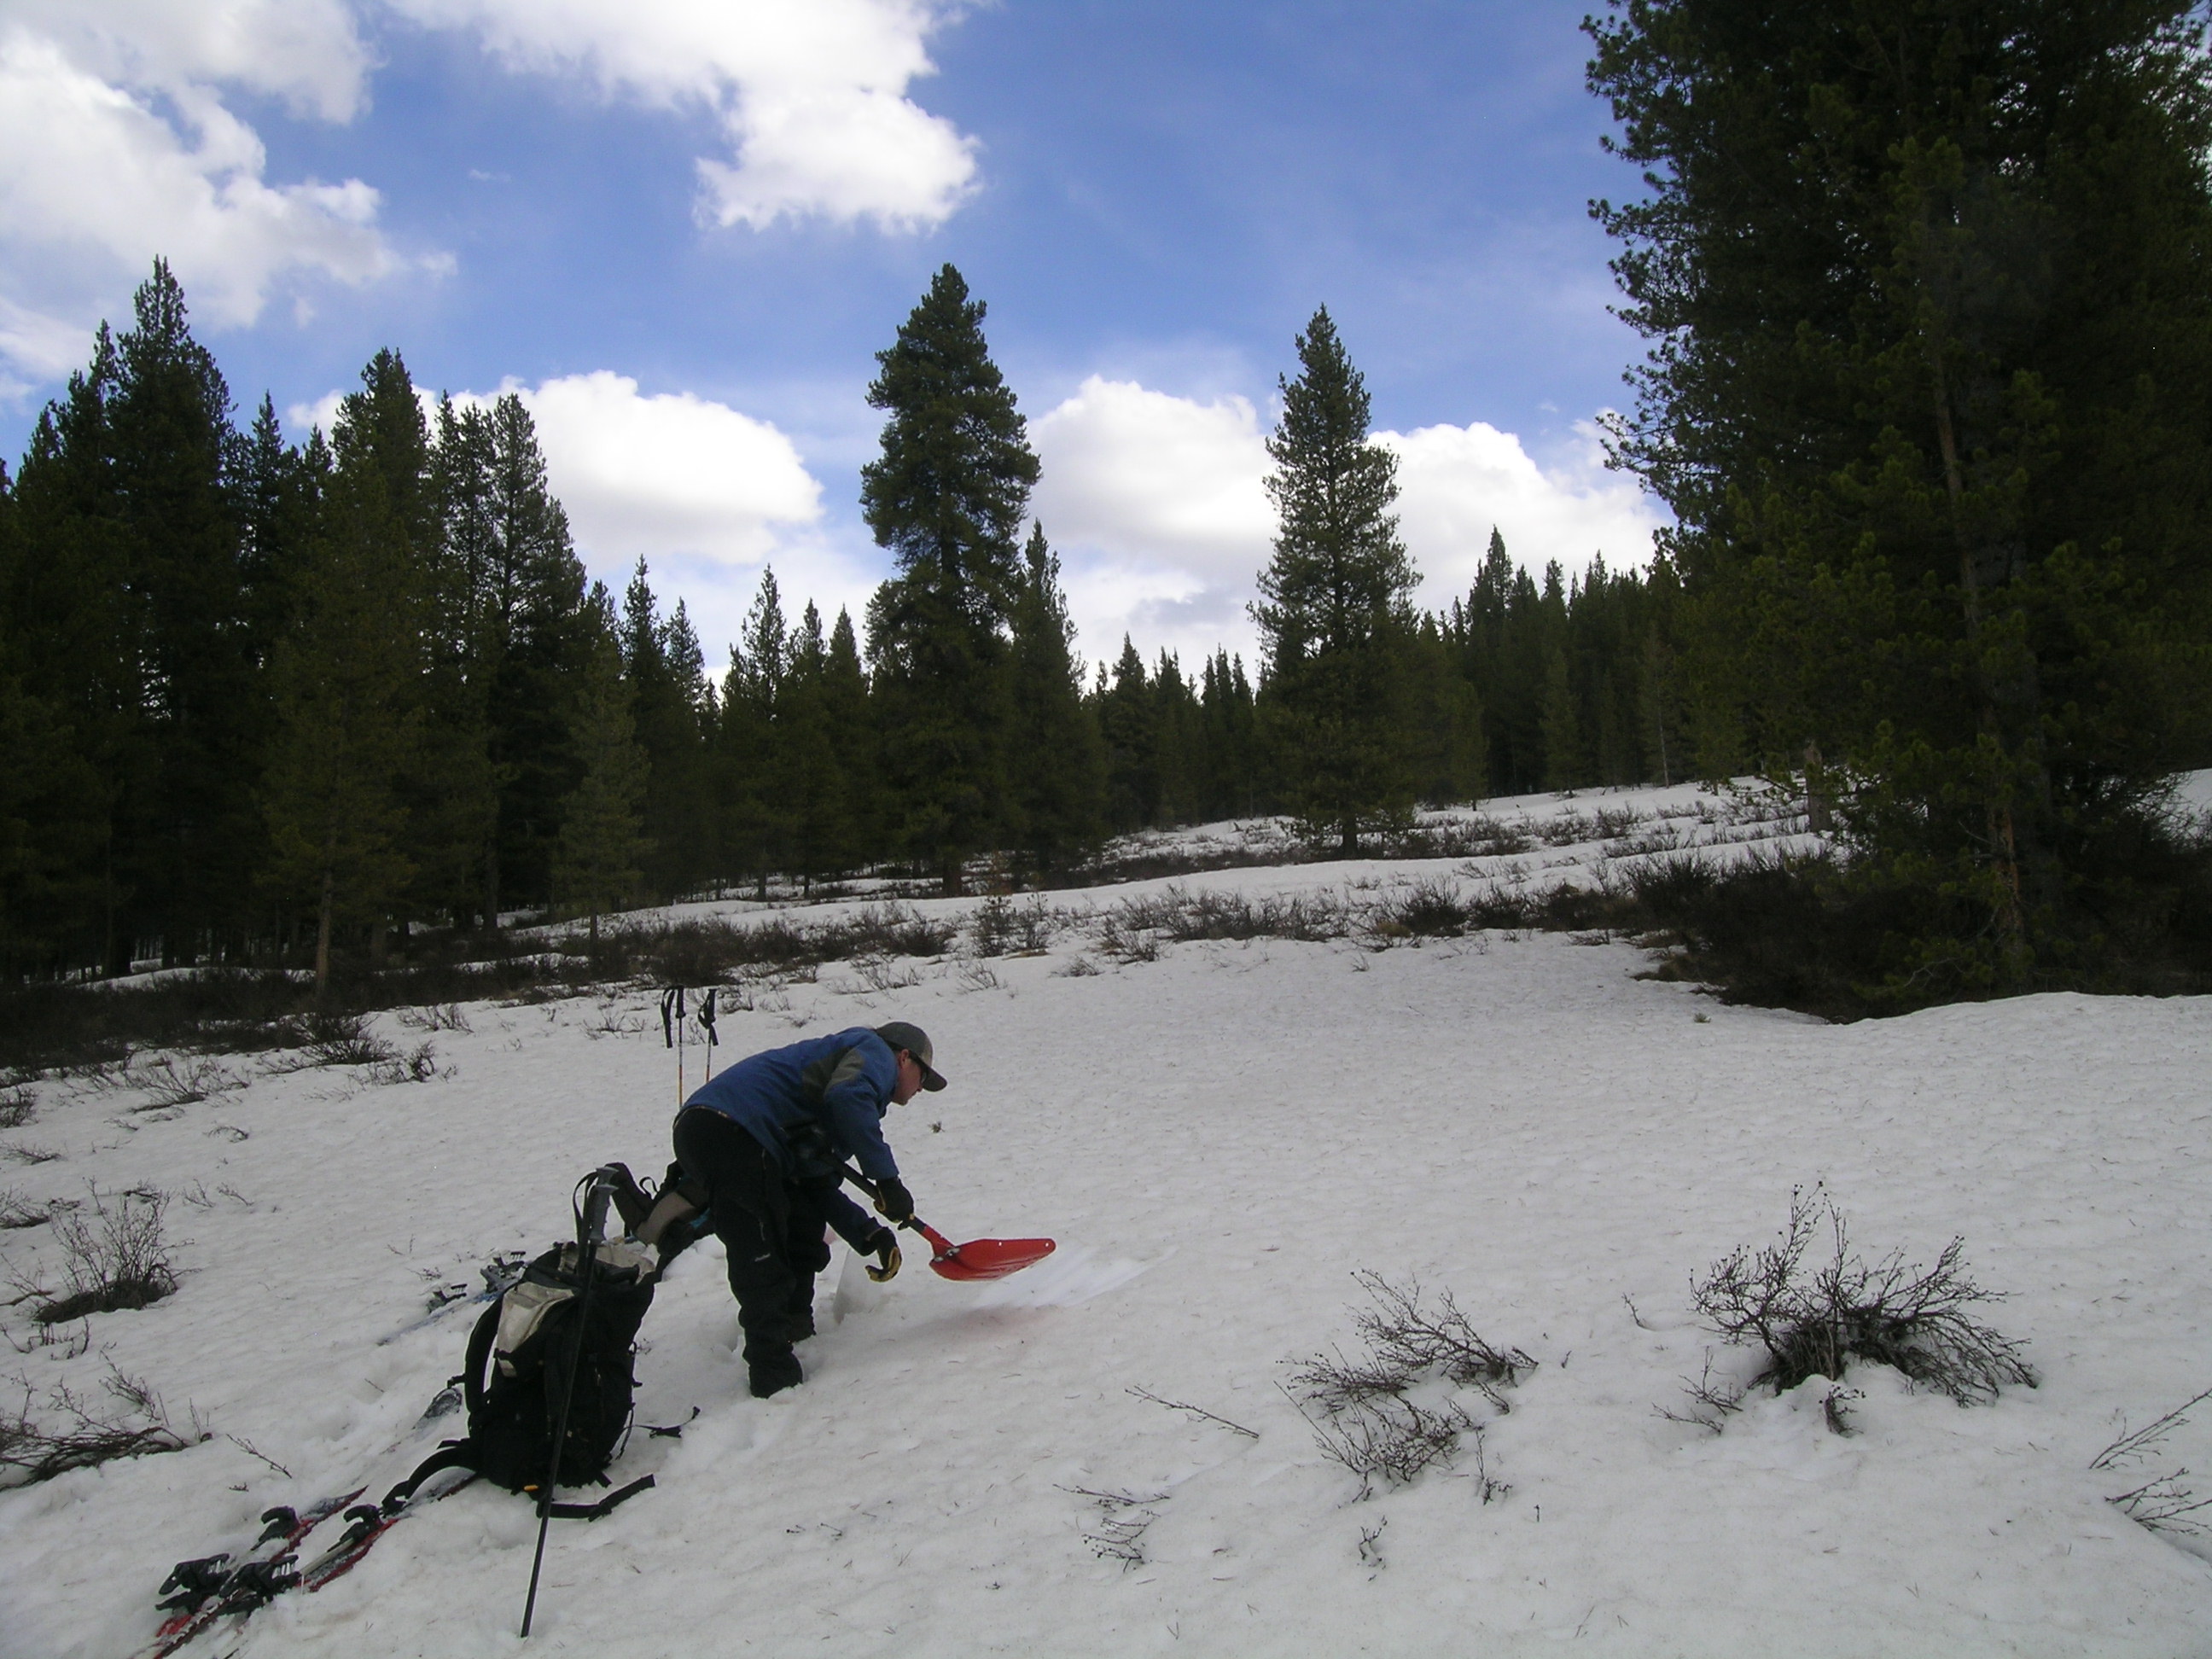
The April 11, 2013 Park Cone snowpit showing the D6 dust layer just below cleaner new snow at the surface. The Park Cone Snotel site is less
than 50 yards away, in the forest seen in the background. This snow profile was isothermal, with snow temperatures at 0.0° C throughout.
Our final site visit on April 30 found large areas of open ground in our CODOS snow profile site, located in an open meadow adjacent to the forested Snotel site. For the duration of snowcover, dust layers D6 and D8 substantially reduced snow albedo, whenever exposed, and produced significant radiative forcing and acceleration of snowmelt at Park Cone and in the surrounding terrain. See the Melt Rate discussion below.
An “all layers merged” sample was collected, in scattered trees below the CODOS
site on April 30, to capture the D8 event merged with D6. The CODOS snow profile
site itself had large patches of open ground on this date.
Melt Rates
Even though dust layers D8 and D6 were high in the snow column and quick to emerge following peak SWE, frequently unsettled, cloudy weather and occasional fresh snowfalls in the upper Gunnison River watershed reduced the potential maximum radiative forcing effects of the merged D8/D6 dust. Once merged, those layers experienced only short periods of sustained exposure under clear, sunny skies. Cloud cover often reduced solar insolation onto the exposed D8/D6 layer and/or fresh snow temporarily restored a higher albedo to the snowpack and substantially slowed melt rates.
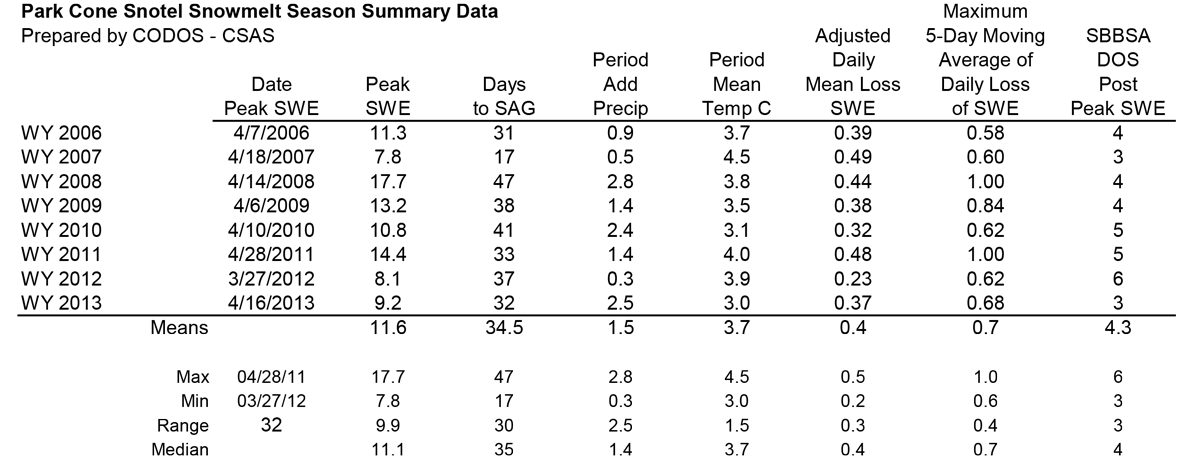
Analysis of Park Cone Snotel data for Water Years 2006-2013 snowmelt seasons showing date and quantity of peak SWE, days from peak SWE to “snow all gone”
(SAG), total additional precipitation after the date of peak SWE, an “adjusted” mean daily rate of snowmelt adding the additional precipitation to the peak SWE total,
the maximum five-day moving average of daily melt, and the mean air temperature over the entire snowmelt period, from peak SWE to SAG.
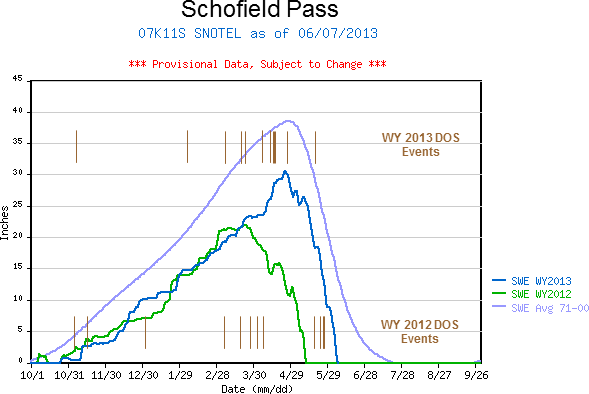
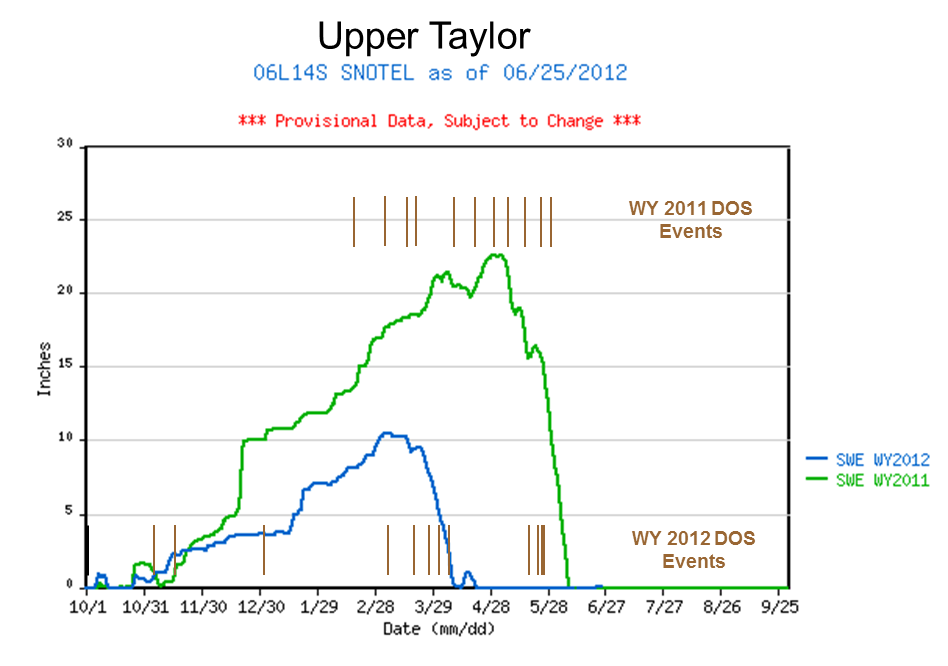
Following peak SWE at the Park Cone Snotel of 9.2” on April 16, 2013, an additional 2.5” of SWE was added to the snowpack during the ablation cycle for an adjusted total of 11.7” of SWE available to melt. Then, over the 32 days from peak to SAG, fully 3.3” more SWE was melted (to SAG) in 5 fewer days and under cooler mean air temperatures than in spring 2012, a lighter dust season. That more rapid snowmelt was driven by the intensity of radiative forcing produced by merged dust layers D8 and D6. Melt rates were as high as 0.9” SWE loss per day and the maximum 5-day moving average daily melt rate was slightly higher than observed in WY 2012, at 0.68” SWE loss per day. In the end, SAG occurred several days after the median date at Park Cone. At the nearby Schofield Pass Snotel, SAG fell very near the median date. NRCS has not yet developed this quartile plot for the comparatively new Upper Taylor Snotel site.
WY 2013 SWE accumulation and ablation at Park Cone Snotel, with upper and lower quartiles of period of record shown in light grey, middle quartiles in dark grey, and the median trace for the period of record shown as a dashed line.
Stream Flows
Comparison of WY 2011, 2012 and 2013 (in progress) USGS hydrographs for the Gunnison River near Gunnison gauge and other nearby gauges highlight variations in snowmelt runoff timing and volumes over those three seasons. WY 2011 snowmelt proceeded in close concert with median timing of ascending, peak, and descending stages, albeit with higher peaks and larger runoff volumes than average. On the Gunnison main stem, WY 2012 snowmelt runoff began earlier than normal with a very rapid surge to a ‘first peak’, then oscillated at lower levels until a second strong surge to a ‘second peak’ at or near the date of average peak discharge but far below average peak discharge levels. WY 2012 total snowmelt runoff yields were very far short of average yields on the Gunnison main stem and on the East Fork but the Lake Fork watershed more closely approached normal yields.
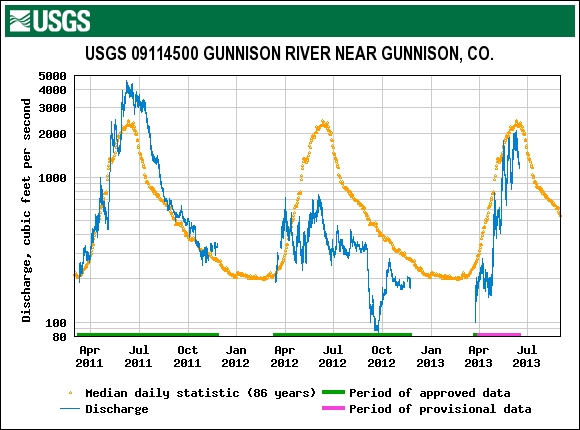
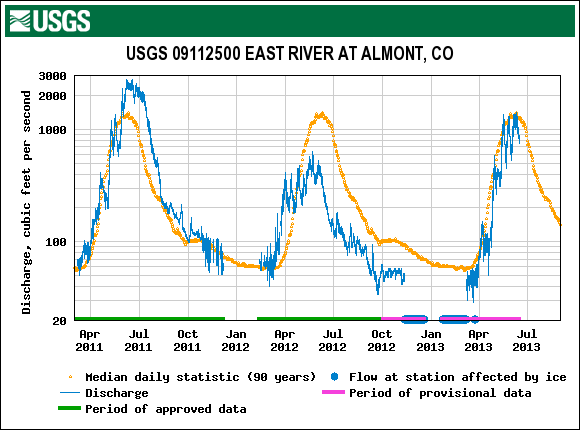
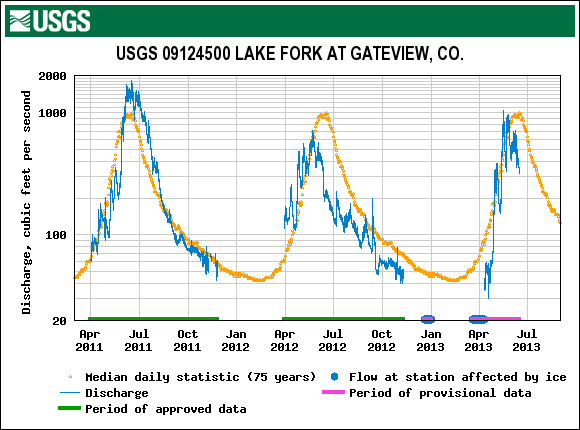
This season, onset of WY 2013 snowmelt runoff was almost a month later than in WY 2012 thanks to this spring’s March and early April storms, versus the extremely dry and sunny March of 2012. Overall, despite the frequent interruptions to D8/D6 radiative forcing described above, the WY 2013 ascending limbs in these hydrographs show a steeper rate of increase than in WY 2012. WY 2013 peak flows on the Gunnison main stem occurred near the median date of peak but fell short of the median level. Peak flows on the East River have closely matched the median peak. WY 2013 Lake Fork peak flows were early and followed by a rapid decline and what will likely become a highly compressed runoff cycle. As the calendar approaches summer solstice, radiative forcing of snowmelt is likely to be much more sustained in the remaining, very dirty snowcover. Although the descending limb has just begun on the Gunnison and East Rivers, and total SWE available for melt was greater this year than last, these WY 2013 hydrographs may also eventually depict a rapid decline in discharge levels and a “flashy” runoff cycle ending below median mid-summer discharge levels.